
IMAGE
Fig. 2
- ID
- ZDB-IMAGE-150120-21
- Genes
- Publication
- Kuo et al., 2014 - Hedgehog-PKA Signaling and gnrh3 Regulate the Development of Zebrafish gnrh3 Neurons
- All Figures
- Figures for Kuo et al., 2014
Image
|
Figure Caption
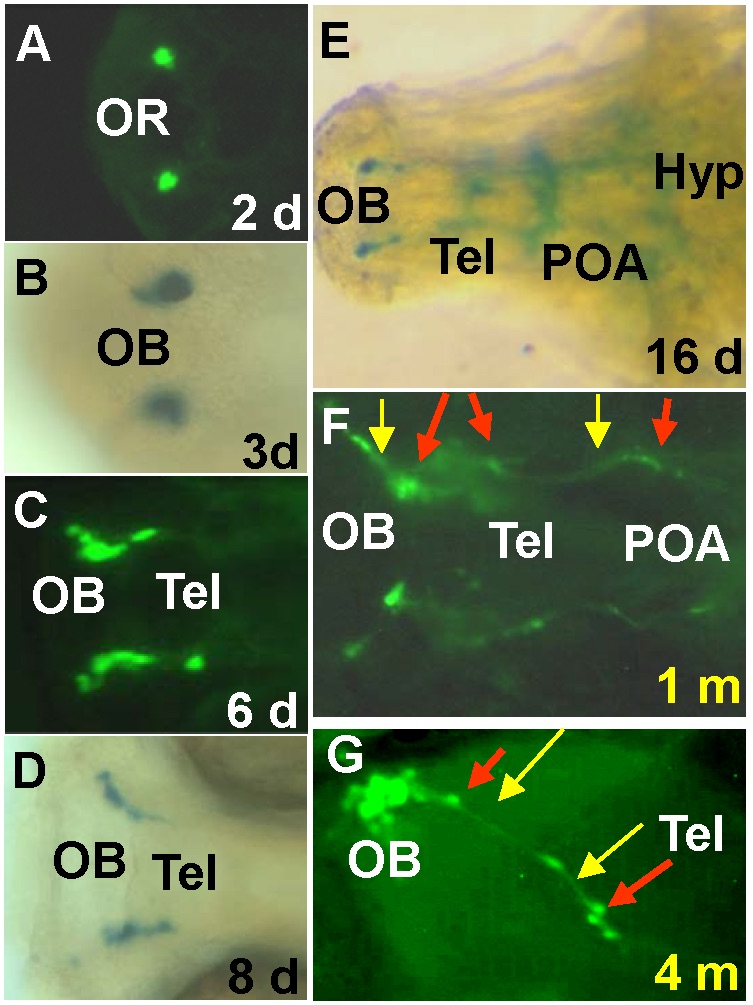
Fig. 2 Detection of GFP- and LacZ-expressing cells in transgenic fish.
A, GFP expression at the olfactory region (OR). B–D, GFP or LacZ cells in the olfactory bulb (OB) and telencephalon (Tel) at 3–8 d (days). E, lacZ cells and axons in the brain at 16 dpf. Hyp, hypothalamus. F–G, At 1 month (m) and 4 months, fluorescent axonal extensions are at OB, Tel and POA (preoptic area). Red arrows indicate cell bodies, yellow arrows indicate axons. A, C, F, G, GFP cells; B, D, E, LacZ-expressing cells. The anterior is towards the left in all panels. A, B, F, G, ventral view; C-E, dorsal view.
Figure Data
Acknowledgments
This image is the copyrighted work of the attributed author or publisher, and
ZFIN has permission only to display this image to its users.
Additional permissions should be obtained from the applicable author or publisher of the image.
Full text @ PLoS One