Fig. 1
Fig. 1
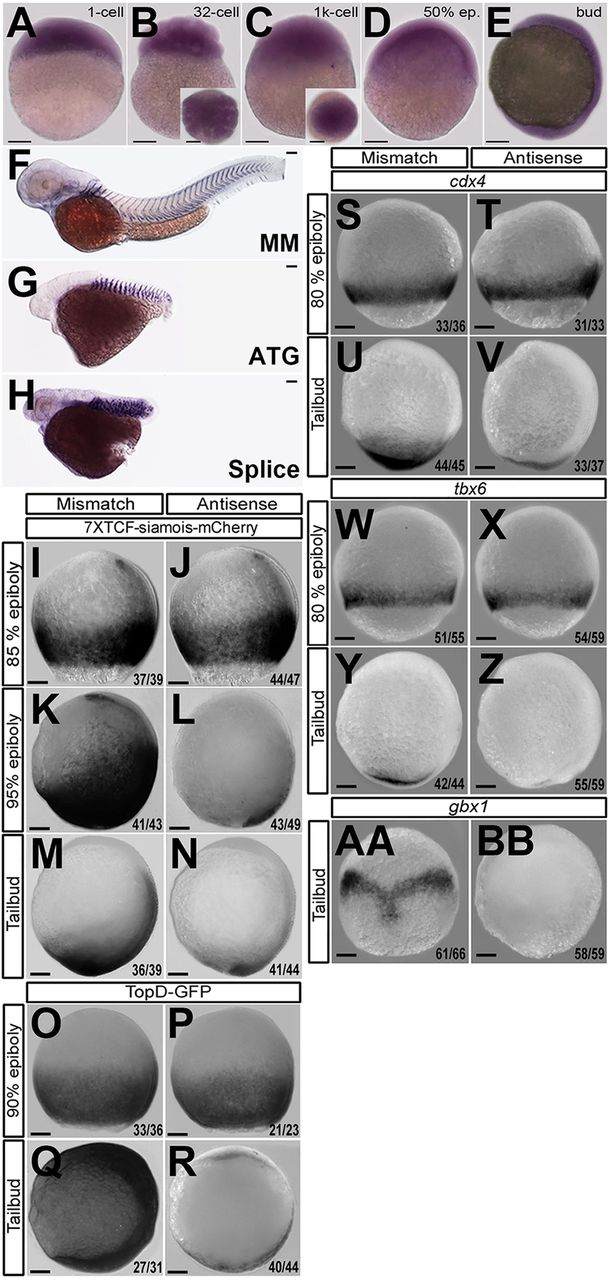
Loss of smp causes Wnt-related developmental phenotype and loss of Wnt-dependent gene expression. (A) smp mRNA (dark purple) in the single-cell embryo. (B,C) The smp transcript in 32-cell embryo (B) and in 1000-cell embryo (C). Expression remains ubiquitous at 50% epiboly (D) and at tailbud (lateral view) stage (E). (F) Control embryo (MM) 24h post-fertilization (hpf) after injection with mismatch smp morpholino at the one-cell stage. In situ hybridization with a xirp2 probe highlights somatic muscle boundaries. (G,H) Injection of antisense morpholino to the start (ATG) site (G) or first intron-exon (splice) boundary (H) of smp in 24hpf embryos. Activation of 7xTCF:mCherry in mismatch control embryos (I,K,M) compared with smp morphants (J,L,N). Activity of Top:dGFP in control embryos (O,Q) compared with smp morphants (P,R). cdx4 expression at indicated stages in mismatch controls (S,U) and in smp morphants (T,V). Expression of tbx6 at indicated stages in controls (W,Y) and smp morphants (X,Z). Expression of gbx1 at tailbud stage in controls (AA) and smp morphants (BB). Numbers in lower right corners of the panels indicate the number of embryos with the depicted expression pattern/the total number of animals. Scale bars: 100μm.

