
Fig. 7
- ID
- ZDB-IMAGE-141006-1
- Genes
- Antibodies
- Publication
- Boczonadi et al., 2014 - EXOSC8 mutations alter mRNA metabolism and cause hypomyelination with spinal muscular atrophy and cerebellar hypoplasia
- All Figures
- Figures for Boczonadi et al., 2014
|
Fig. 7
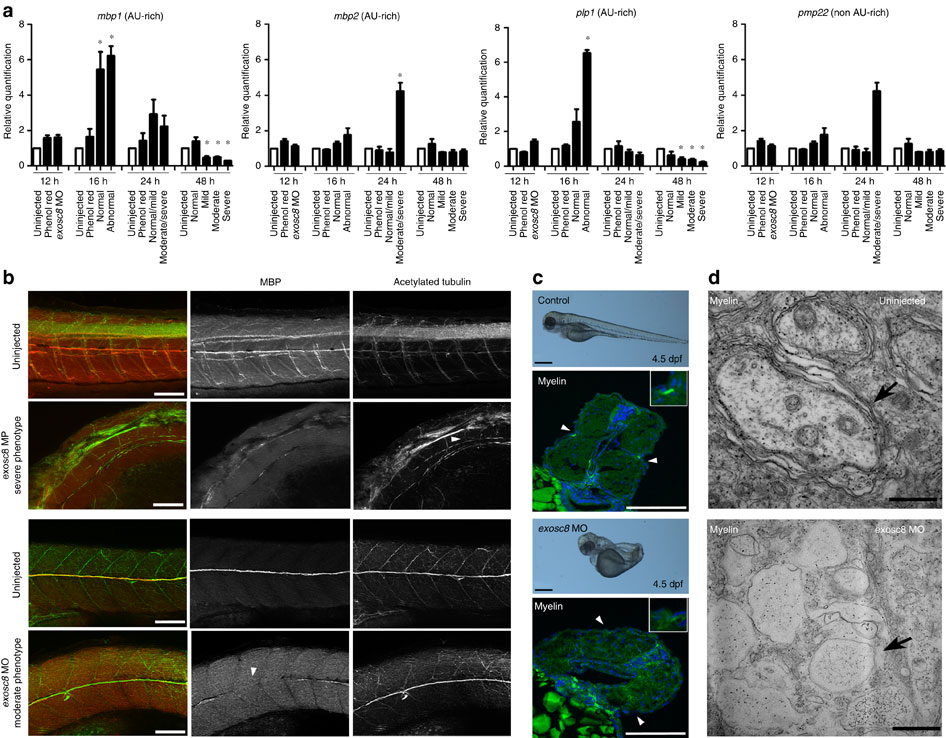
(a) exosc8 MO injected larvae were analyzed for expression of AU-rich mRNAs during 48 hpf by real-time PCR. At 16 hpf expression of mbp1 and plp1 was increased in embryos with an abnormal phenotype, with a similar increase in mbp2 observed at 24 hpf. Despite this initial increase, by 48 hpf there is a dramatic decrease in mbp1 and plp1 expression in larvae with a moderate and severe phenotype. Each bar or severity group at different timepoints represents a number of 15–20 embryos. Statistically significant changes (P<0.05) are marked with *. Unpaired t-test was used for statistical analysis. Error bars represent s.d. of three experimental repeats. (b) Un-injected control larvae and exosc8 MO injected larvae were analyzed for myelination at 96 hpf. Larvae were stained with antibodies against the zebrafish MBP and against acetylated tubulin. Left column: overlay, MBP staining in red, acetylated tubulin staining in green; middle column: MBP staining; right column: acetylated tubulin. Top row: tail of control larva: motor axons in each somite are clearly visible and myelinated at 96 hpf. Second row: tail of MO injected larva with a moderate phenotype: the spinal cord is curved and has an irregular structure. Motor axons in the somites are either very short (arrowhead) and thin or missing completely and are not MBP-positive. Third row: un-injected control larva, posterior lateral line, intact myelin. Bottom row: exosc8 MO injected larva with moderate phenotype: the lateral line is present (green acetylated tubulin signal) but the myelination of its neurons is interrupted (arrowhead). Scale bar, 100 μm. (c) Myelin staining of the lateral line was studied in control un-injected and exosc8 MO injected zebrafish larvae at 4.5 dpf. Representative images of the analyzed embryos are shown on the top (scale bar, 0.25 mm) and transverse sections of the embryos are shown on the bottom. In the control larvae the myelinated lateral line is present at both sides (white arrowheads). However, no myelination of the lateral line was detected in the exosc8 MO injected larvae (white arrowheads). Higher magnifications are shown in the upper right hand corners. Scale bar, 100 μm. (d) Representative EM pictures of the myelin sheath at the lateral line in un-injected and exosc8 MO injected zebrafish larvae at 4 dpf. Black arrows indicate the myelin sheet around the axon. Scale bar, 500 μm.