
|
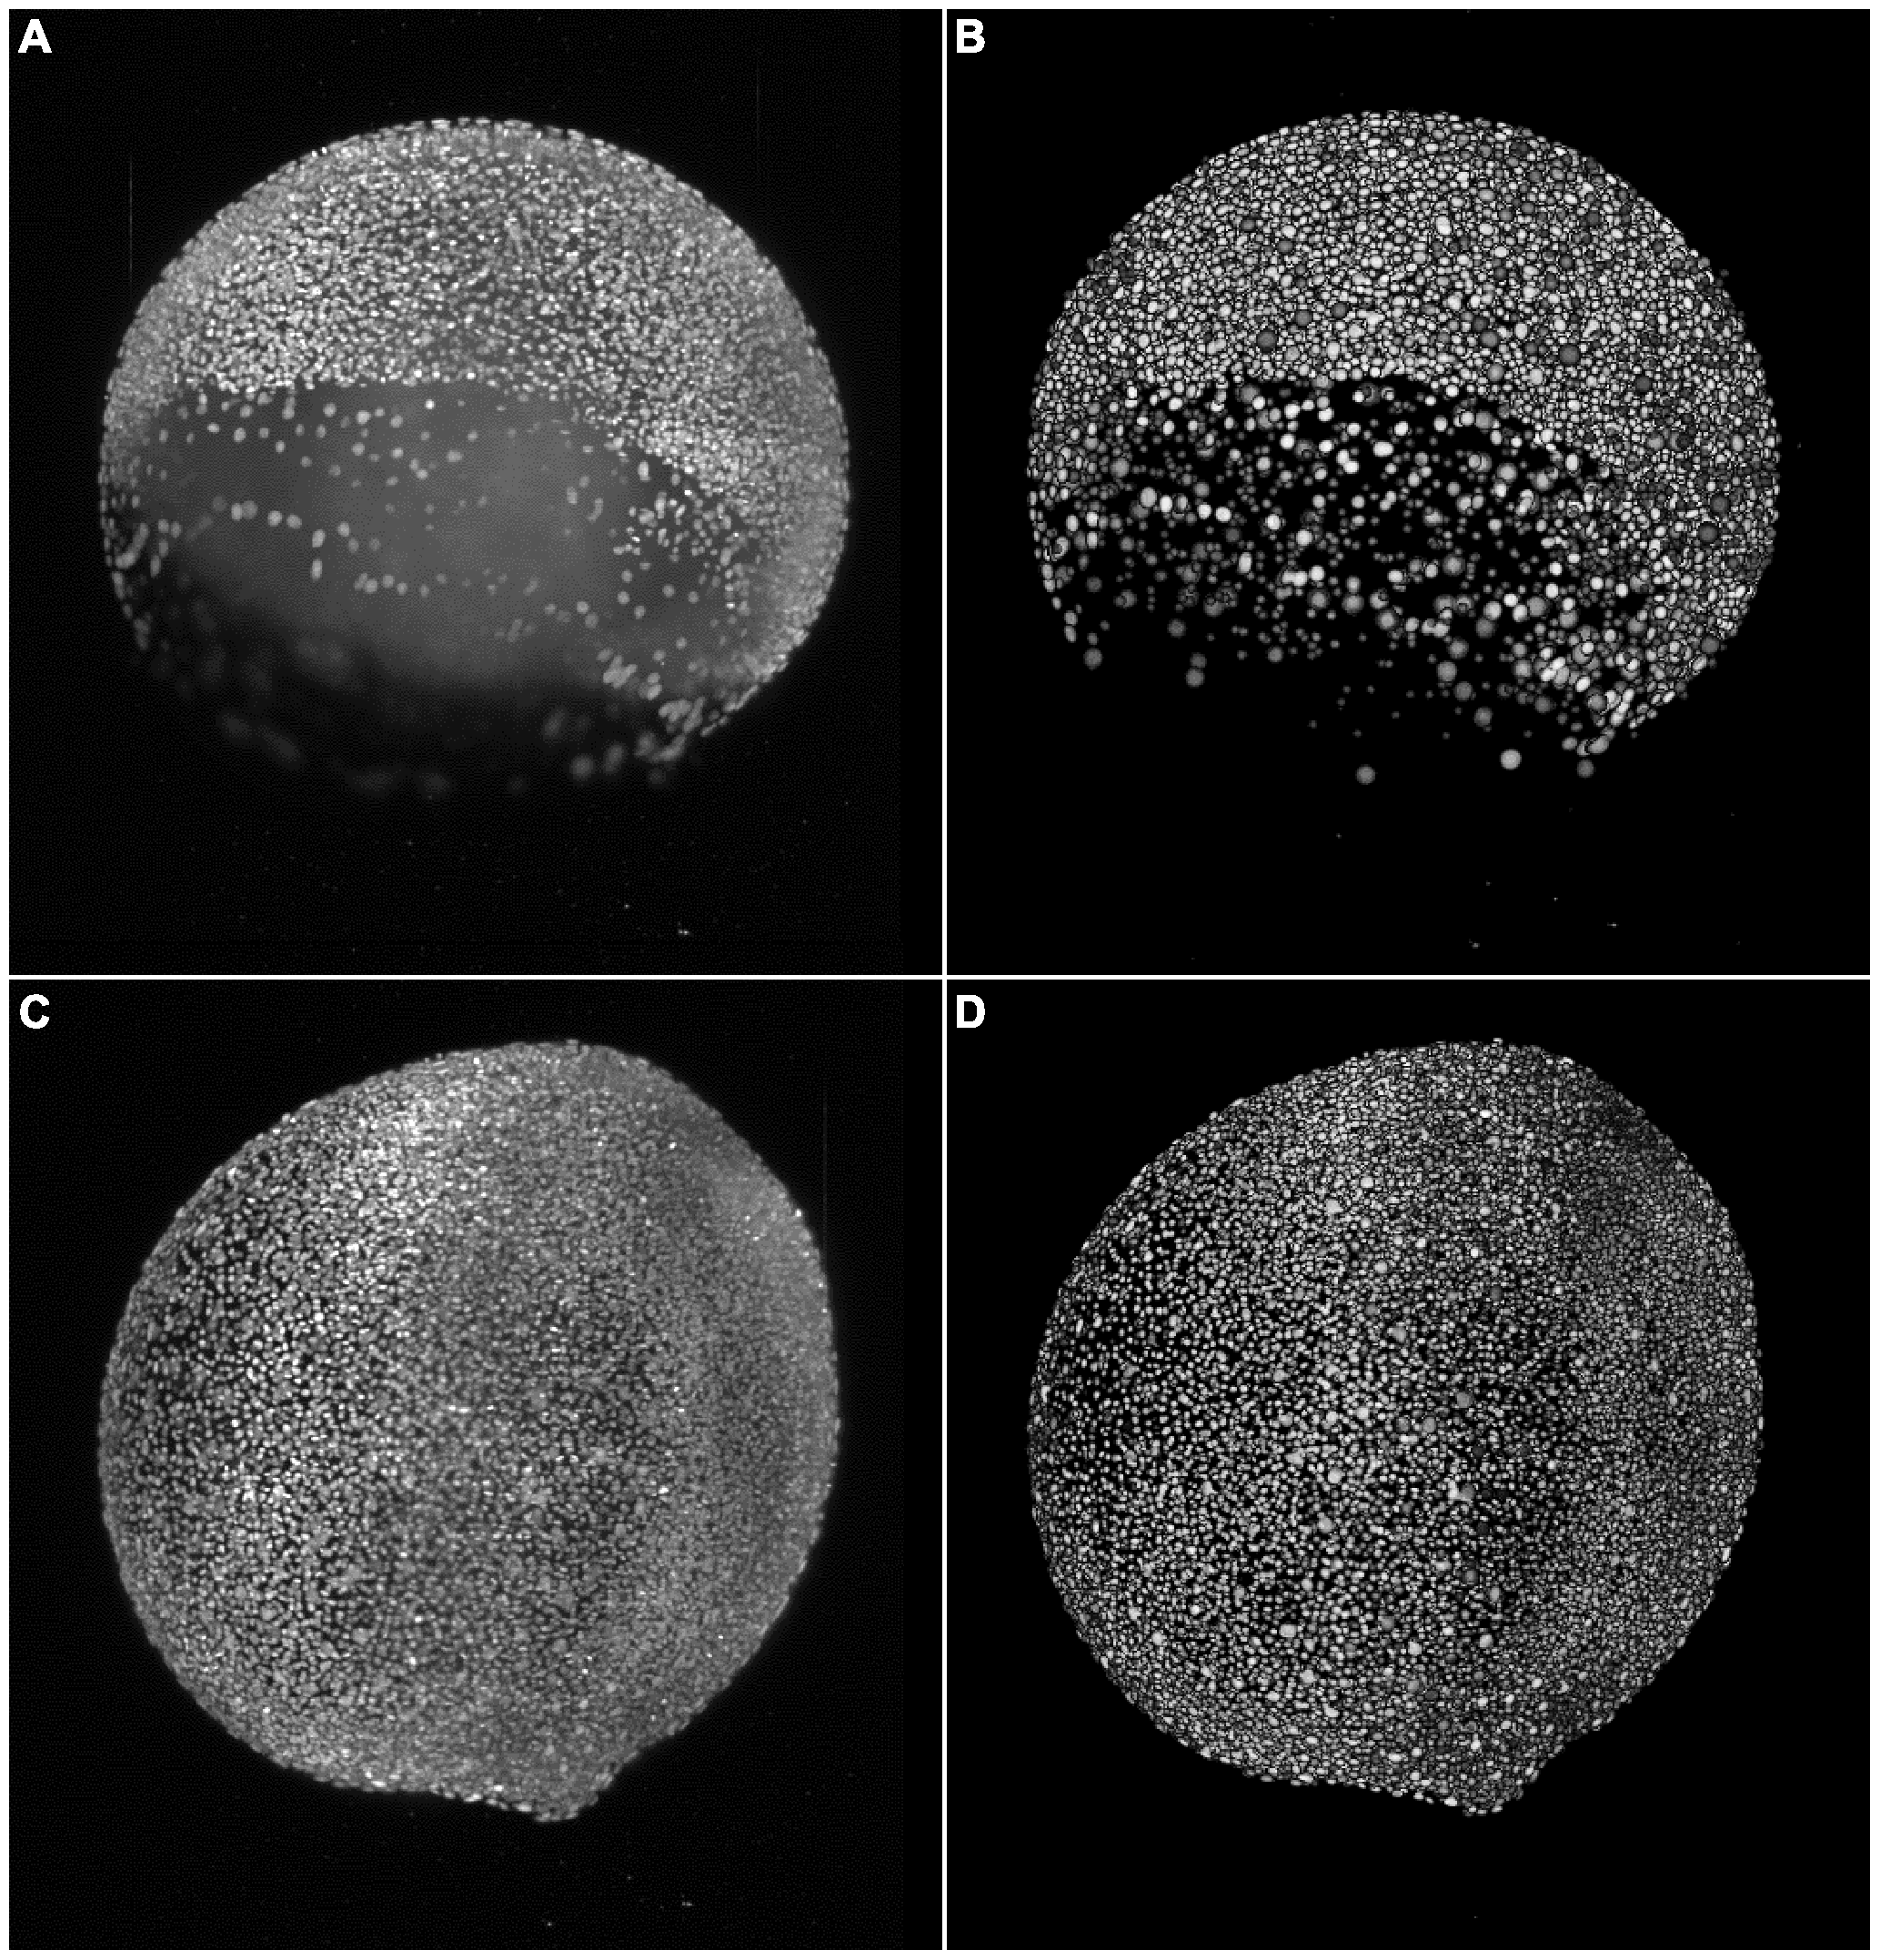
Fig. 8
Results of the TWANG segmentation pipeline applied on two images of a developing zebrafish embryo.
The images were captured at the 7≈8000 cells (A,B) and at the 11 hpf stage with ≈12000 cells (C,D), respectively. The panels show maximum intensity projections of the raw images (A,C) and the resulting segmentation using our TWANG segmentation pipeline (B,D). Each 3D image stack has a file size of ~5GB and comprises 2560×2160×500 voxels with a dynamic range of 16 bits. Processing one image stack takes approximately 10-20 minutes on a common desktop machine, depending on the developmental stage of the embryo. Typical experiments may be comprised of up to 2000 z-stacks (~10TB) for the spatio-temporal analysis of a single embryo.