
|
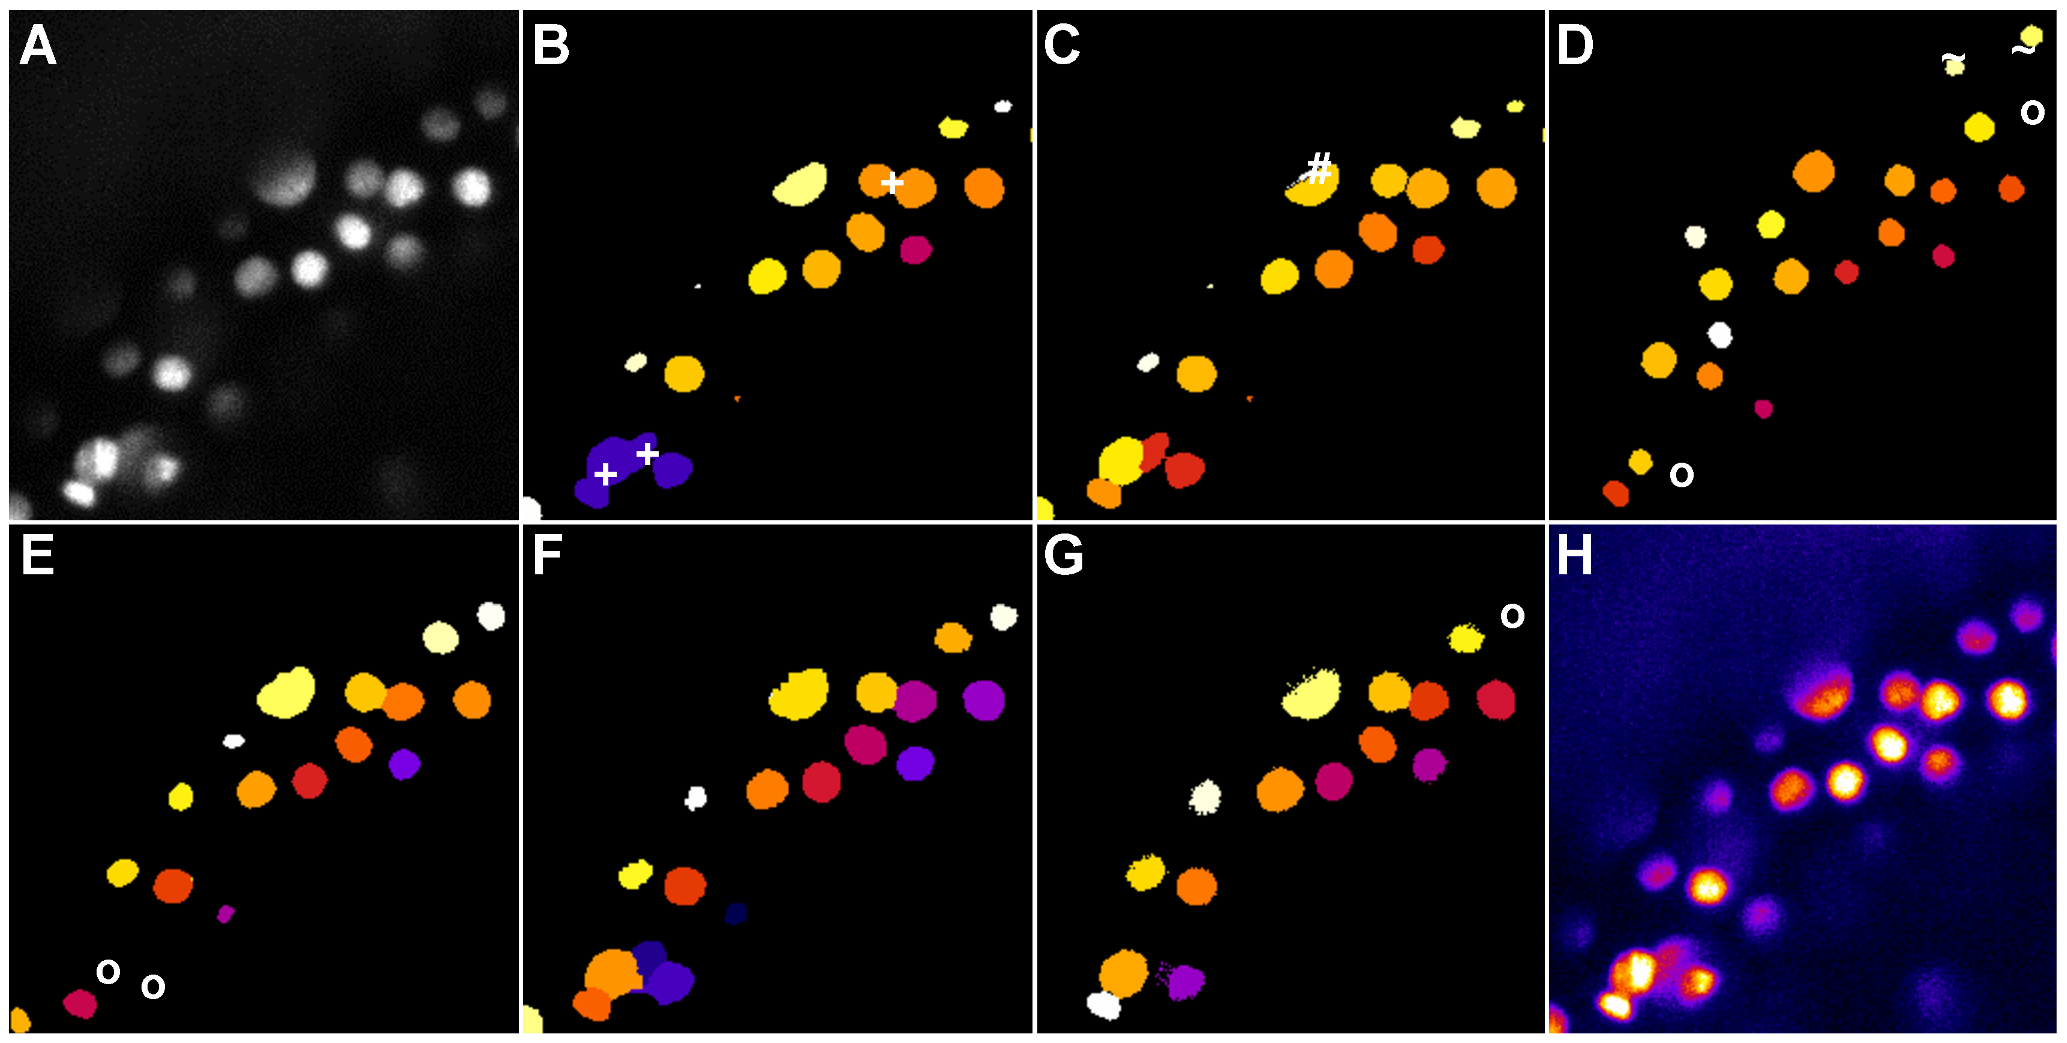
Fig. 7
Comparison of the segmentation quality achieved by the investigated algorithms on a 3D image of labeled nuclei of a zebrafish embryo acquired using DSLM.
The panels show the maximum intensity projection of 3 neighbouring z-slices. Original image (A), adaptive thresholding using Otsu’s method [23] (B), Otsu’s method combined with watershed-based blob splitting [23], [30] (C), geodesic active contours [31] (D), gradient vector flow tracking [16] (E), graph-cuts segmentation [17] (F), TWANG segmentation (G) and a false colored original image (H). The symbols indicate segmentation errors for nuclei that are either split (#), merged (+), missing (o) or spurious (~).