
|
Fig. S2
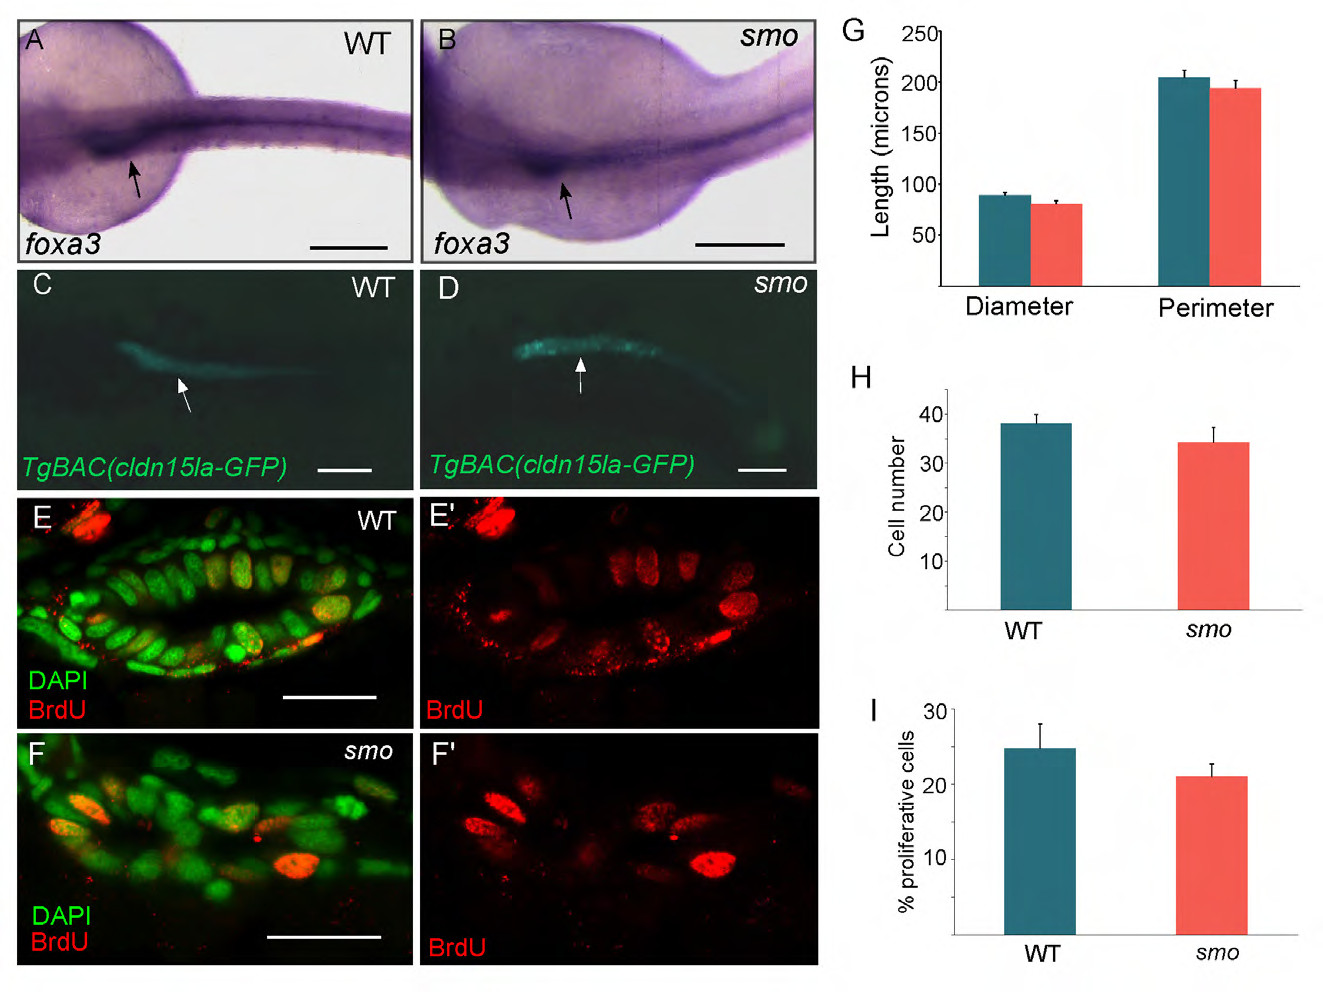
Gut tube shape and total cell number are similar in wildtype and mutant embryos. (A,B) In situ hybridization of WT and smo mutant embryos expressing foxa3 at 30 hpf. Scale bar: 200 μm. (C-D) WT and smo mutant embryo expressing TgBAC(cldn15la-GFP) at 48 hpf. Arrows indicate intestine. (E-F2) Cross section of WT and smo mutant guts at 72 hpf stained for BrdU to label proliferating cells. Scale bars: 20 μm. (G) Quantification of the diameter and perimeter of WT and smo mutant guts from transverse cross sections. Wt n=14, mutant n=18, diameter P>0.18, perimeter P>0.48. (H) Quantification of total cell number in WT and mutant guts. WT n=14, mutant n=18, P>0.30 (I) Quantification of the percent of BrdU positive cells in WT and smo mutant guts. WT n=14, mutant n=19, P>0.32.