
|
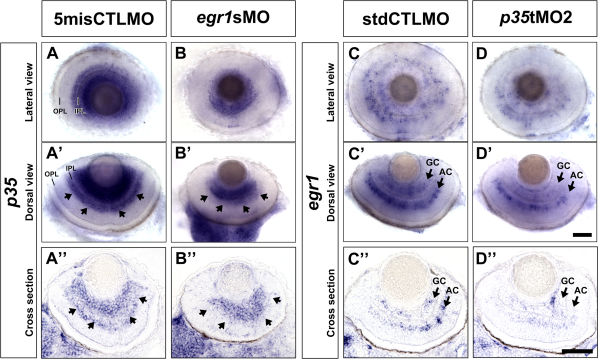
Fig. 5
p35 expression in the AC region of the Egr1-morphant retinas was severely reduced, while egr1 expression in the p35-morphant retinas was modestly attenuated. A,B: Whole-mount in situ hybridization of p35 was performed with the control- (5misCTLMO) and Egr1-morphant (egr1sMO) embryos at 72 hpf. The p35 signal was generally reduced in the Egr1-morphant retinas (B, B′) compared with the controls (A, A′), and it was significantly reduced in the AC region (arrows in A′, B′). The latter was particularly obvious on the sectioned retinas (A′′, B′′). C,D: Whole-mount in situ hybridization of egr1 was performed with the control- (stdCTLMO) and p35-morphant (p35 tMO2) embryos. In the controls, egr1 was strongly expressed in the GCL and AC region at 72 hpf (C-C′′; arrows), while in the p35 morphants, egr1 signal was reduced in the GCL and AC region (D-D′′; arrows). Nonetheless, the overall signal reduction in the AC region in the whole-mount retinas was relatively less drastic than that in the GCL (C′, D′). For the lateral view of the dissected eyes in A-D, anterior is to the left and dorsal is up; for the dorsal view in A′-D′, anterior is to the left and lateral is up; while for the cross-section in A′′- D′′, dorsal is to the left and lateral is up. GC, ganglion cell; AC, amacrine cell; IPL, inner plexiform layer; OPL, outer plexiform layer. Scale bars = 50 μm.