
IMAGE
Fig. 2
- ID
- ZDB-IMAGE-140211-28
- Genes
- Publication
- Ton et al., 2013 - Identification of an evx1-Dependent Joint-Formation Pathway during FIN Regeneration
- All Figures
- Figures for Ton et al., 2013
Image
|
Figure Caption
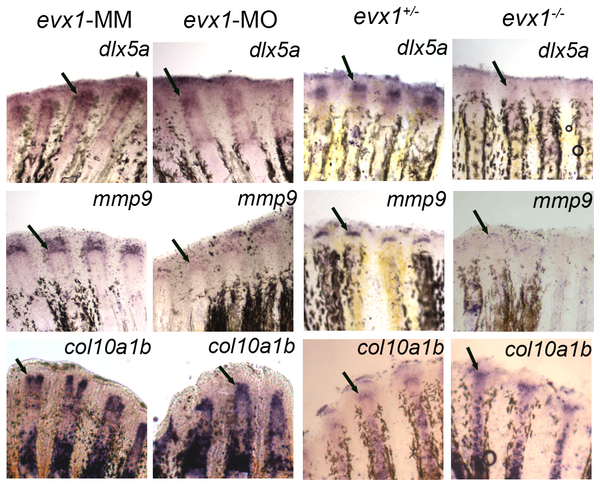
Fig. 2
dlx5a and mmp9 are genes downstream of evx1.
(A) Whole mount ISH shows levels of dlx5a expression and mmp9 expression are reduced in the evx1-morpholino (evx1-MO) injected side compared with the evx1-mismatch (evx1-MM) injected side, while the level of col10a1b expression is unchanged. (B) Whole mount ISH on evx1-/- mutants displays similar results seen in the evx1-MO injected fins, except that a stronger reduction in dlx5a and mmp9 is observed. Arrows identify regions of the fin where staining is present and/or expected (i.e. in the cases where reduced evx1 influences expression levels).
Figure Data
Acknowledgments
This image is the copyrighted work of the attributed author or publisher, and
ZFIN has permission only to display this image to its users.
Additional permissions should be obtained from the applicable author or publisher of the image.
Full text @ PLoS One