
Fig. 2
|
Fig. 2
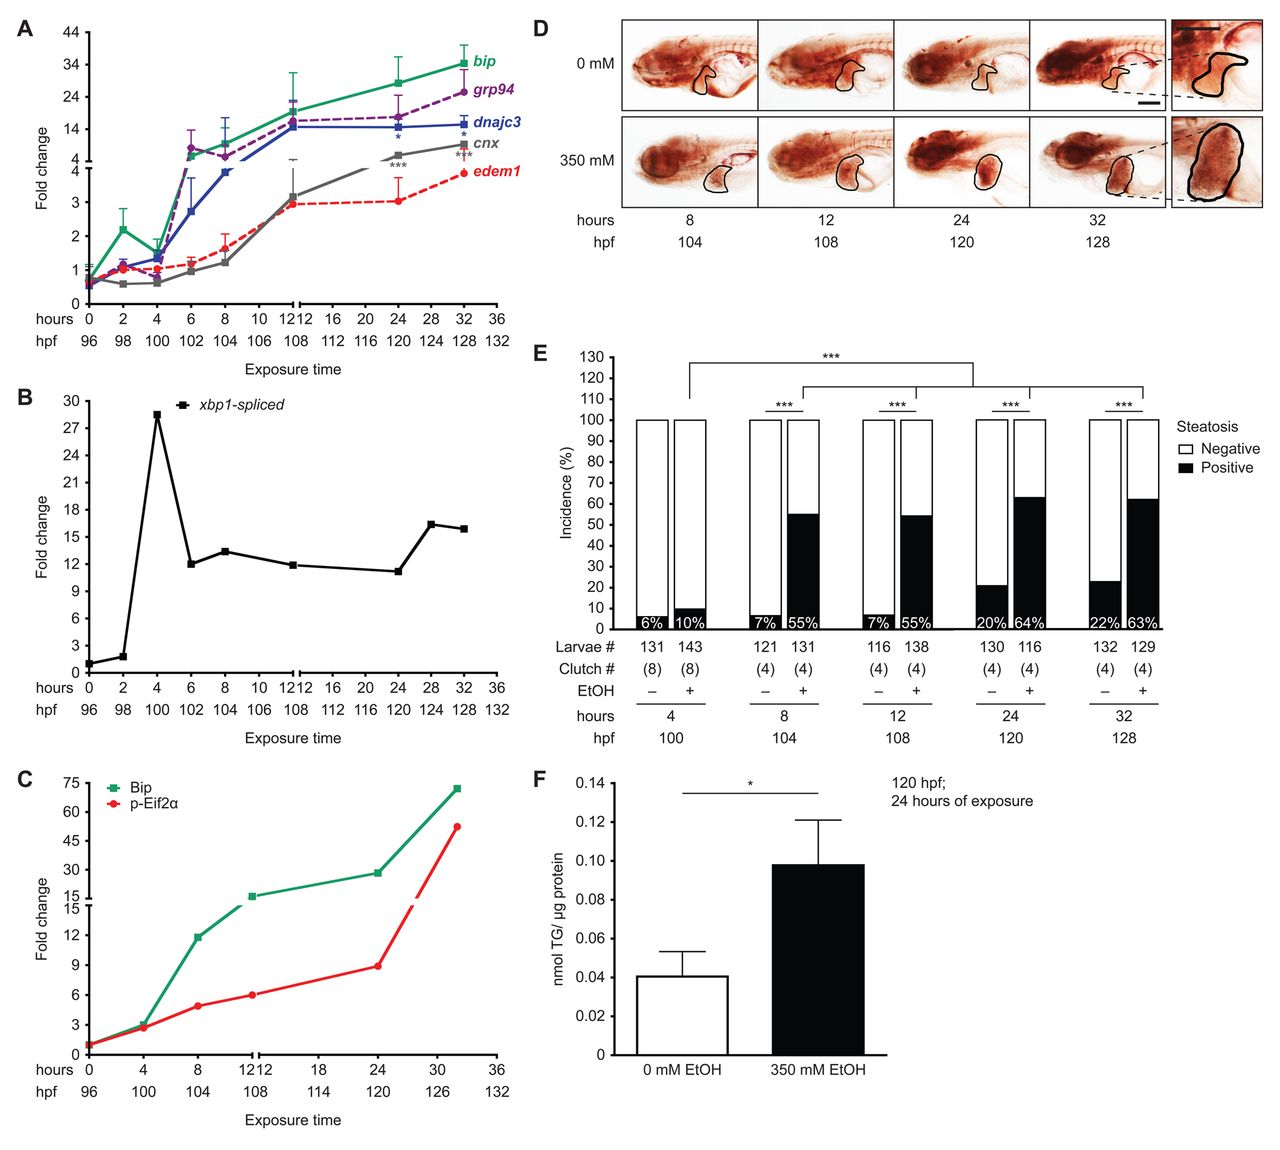
Ethanol-induced UPR in the liver precedes steatosis. (A) qPCR on cDNA prepared from pools of livers dissected from larvae exposed to 350 mM ethanol at 96–128 hpf. Fold changes were calculated by normalizing the comparative threshold (CT) values calculated as 2CT(target)/2CT(rpp0) to the ones obtained from 0 mM. ***P<0.001 and *P<0.05 by one-way ANOVA and Tukey’s post-hoc test. (B) Fold change in the percent of spliced xbp1 from the total xbp1 message present in liver cDNA from larvae exposed to 350 mM ethanol versus untreated controls, based on the PCR shown in supplementary material Fig. S2A. (C) Fold change in Bip protein levels and Eif2α phosphorylation normalized to β-actin was determined from the immunoblots in supplementary material Fig. S2B. (D) Representative images of whole-mount oil red O staining in larvae exposed to 0 or 350 mM ethanol at the indicated times. The livers are circled. The 32-hour image is enlarged to illustrate the lipid droplets used to score steatosis. Scale bar: 0.2 mm. (E) Average percent of steatosis across 4–8 clutches of larvae exposed to 0 (–) or 350 (+) mM ethanol. ***P<0.0001 by Fisher’s exact test. (F) Average triglyceride (TG) levels (nmol) in livers of larvae exposed to 0 or 350 mM ethanol for 24 hours were normalized to total protein (μg). Mean ± s.e.m. n=4 clutches, *P<0.05 by a Student’s t-test.