
Fig. 3
- ID
- ZDB-IMAGE-130906-25
- Genes
- Publication
- Sorrell et al., 2013 - Tcf7l1 proteins cell autonomously restrict cardiomyocyte and promote endothelial specification in zebrafish
- All Figures
- Figures for Sorrell et al., 2013
|
Fig. 3
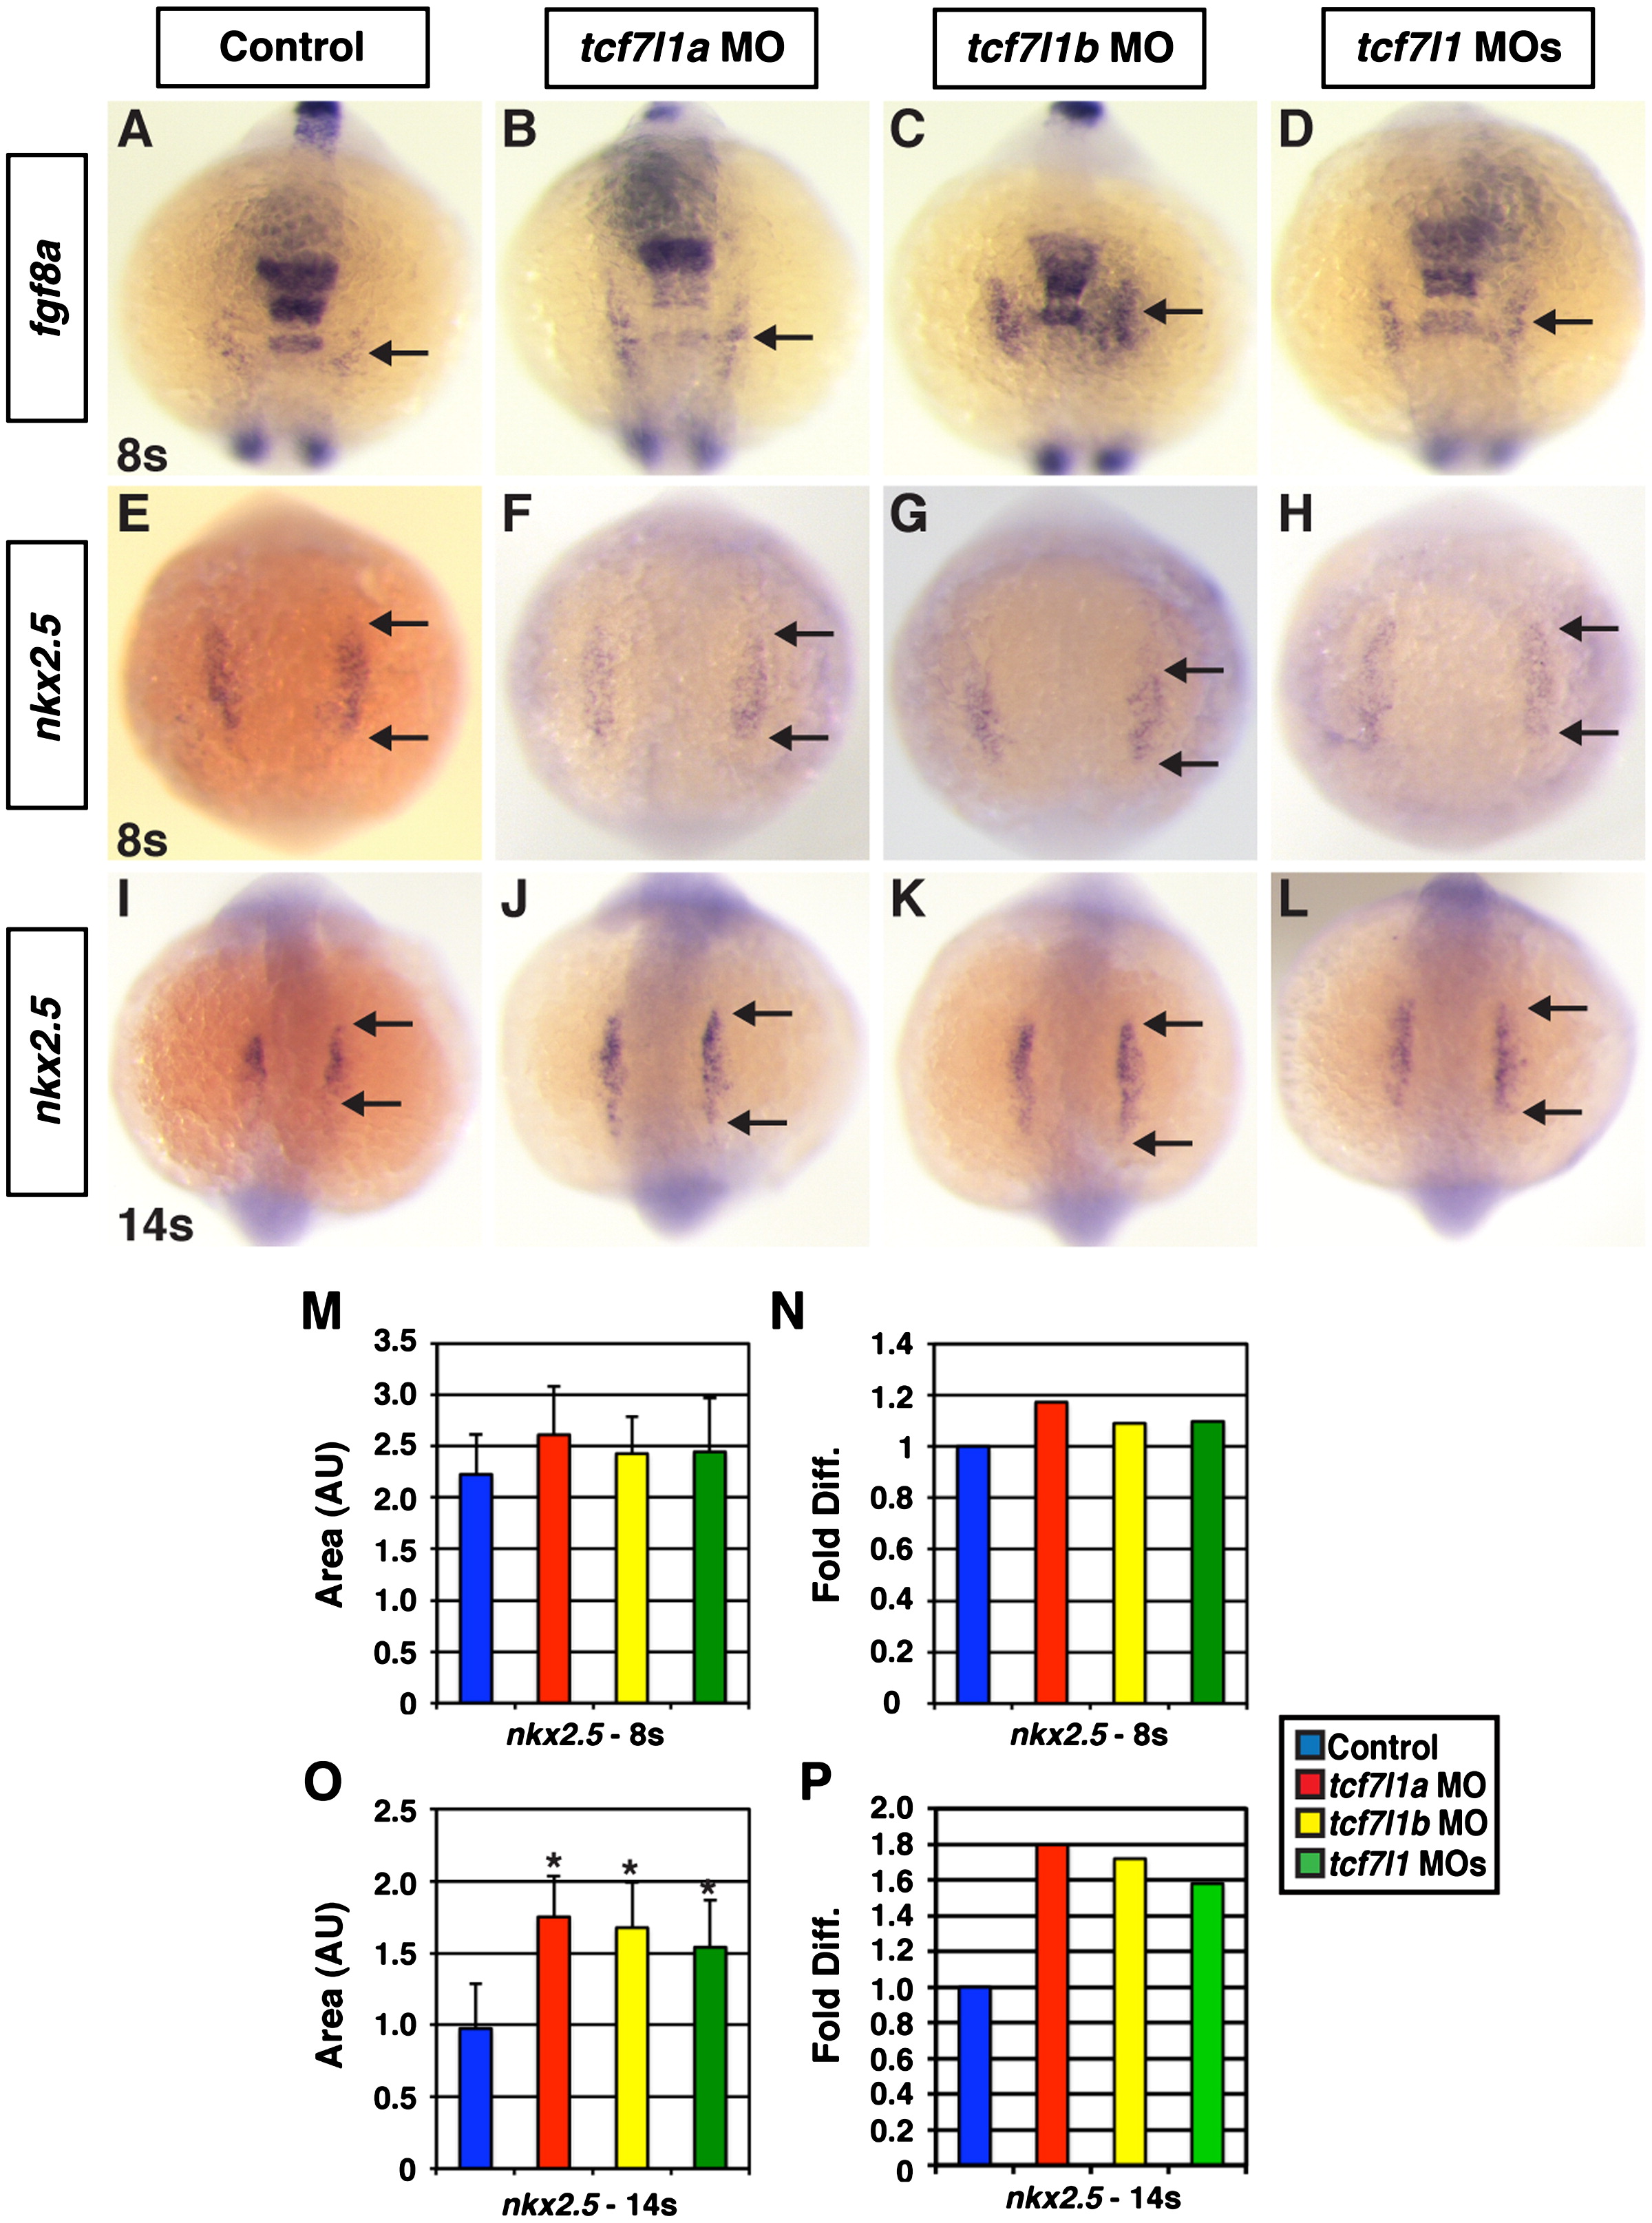
Expression of CM progenitor markers in Tcf7l1 deficient embryos. ((A)–(D)) Fgf8a and ((E)–(H)) nkx2.5 expression at the 8s stage in control, Tcf7l1a deficient, Tcf7l1b deficient, and Tcf7l1 deficient embryos. An increase in fgf8a and nkx2.5 markers relative to control sibling embryos was not observed in Tcf7l1a, Tcf7l1b, or Tcf7l1 deficient embryos at the 8s stage. ((I)–(L)) Nkx2.5 expression at the 14s stage in control, Tcf7l1a, Tcf7l1b, and Tcf7l1 deficient embryos. (M) Area and (N) fold difference of the area of nkx2.5 expressing cells at the 8s stage. For analysis of areas at 8 s, control n=16, Tcf7l1a deficient n=24, Tcf7l1b deficient n=24, and Tcf7l1 deficient n=18. (O) Area and (P) fold difference of the total area of nkx2.5 expressing cells at the 14s stage. For analysis of areas at 14s, control n=44, Tcf7l1a deficient n=37, Tcf7l1b deficient n=39, and Tcf7l1 deficient n=32. All views are dorsal with anterior up. Arrows in (A)–(D) indicate fgf8a expression that is associated with CM specification. Arrows in (E)–(L) indicate the length of nkx2.5 expression. Asterisk indicates a statistically significant difference compared to controls.
Reprinted from Developmental Biology, 380(2), Sorrell, M.R., Dohn, T.E., D'Aniello, E., and Waxman, J.S., Tcf7l1 proteins cell autonomously restrict cardiomyocyte and promote endothelial specification in zebrafish, 199-210, Copyright (2013) with permission from Elsevier. Full text @ Dev. Biol.