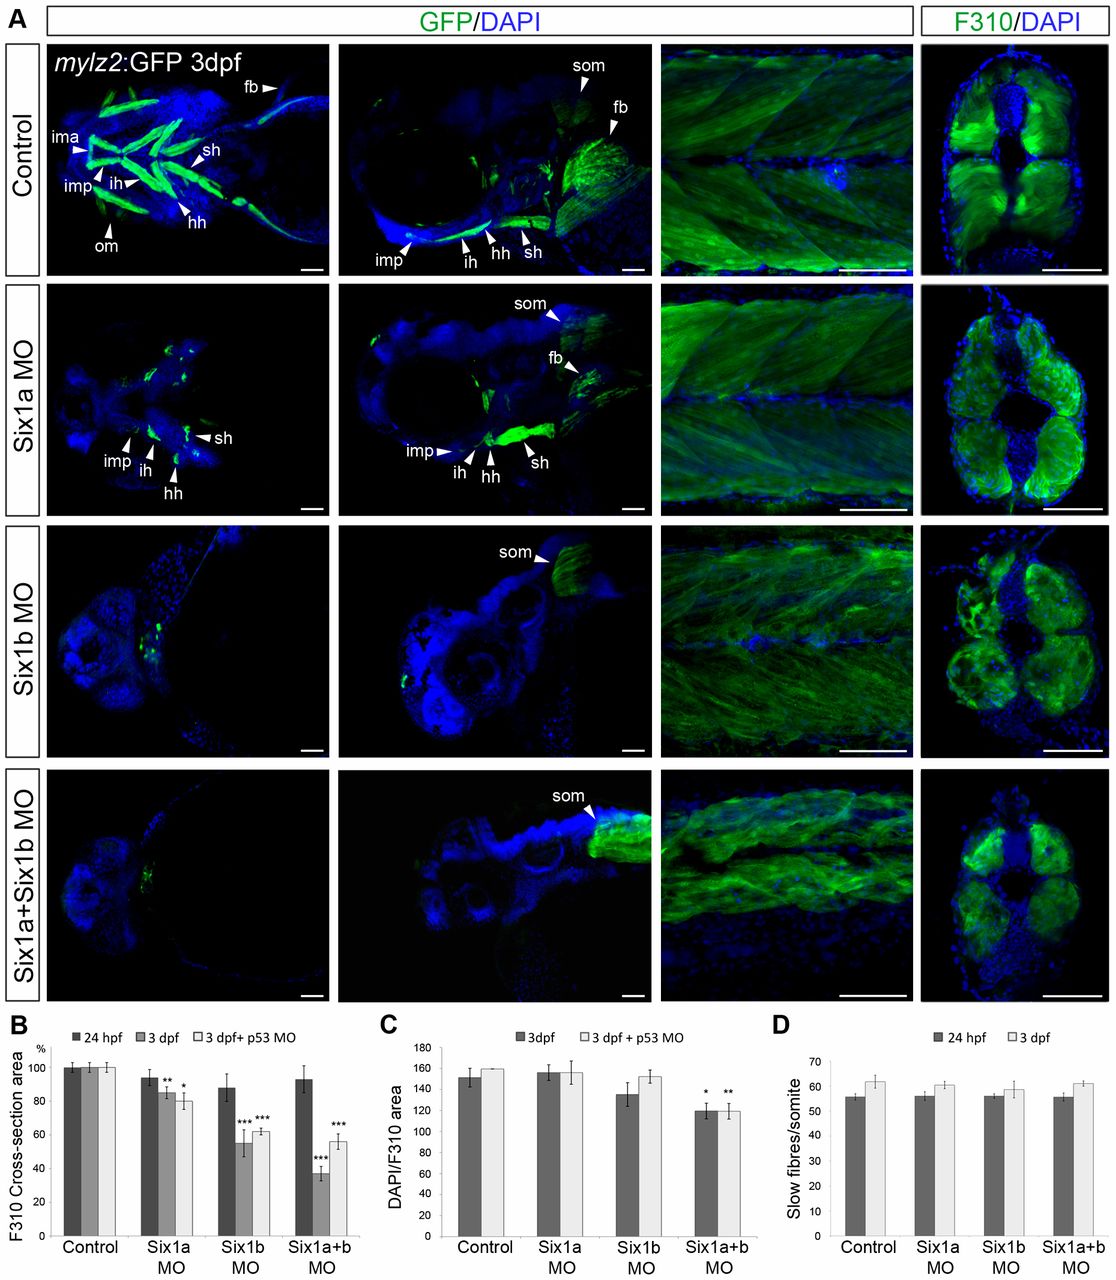
Fig. 2 six1 morphants have a reduced fast muscle area. (A) Ventral and lateral views of head (left two columns) and lateral view and cross-section of the trunk (right two columns) of 3-dpf tg(mylz2:GFP)i135 embryos uninjected and injected with six1a and six1b morpholinos alone or in combination. Cross-sections are stained with F310. (B) F310+ cross-section area of 24-hpf and 3-dpf embryos; the area of uninjected control embryos is set as 100%. Compared with control embryos at 24hpf (n = 5), six1a morphants have an area of 94.0% (n = 5), six1b morphants 88.4% (n = 5) and six1a and six1b double morphants 92.8% (n = 5). In 3-dpf embryos compared with control embryos, (n = 5) six1a morphants have an area of 84.9% (n = 5), six1b morphants 55.0% (n = 5) and six1a/six1b double morphants 37.2% (n = 6). Compared with uninjected control embryos (n = 4) set as 100%, six1a/p53 morphants have an F310+ cross-section area of 79.7% (n = 4), six1b/p53 morphant embryos 62.1% (n = 5) and six1a/six1b/p53 triple morphants have an area of 55.6% (n = 4). (C) Average number of DAPI-stained nuclei per F310+ (fast muscle specific) cross-section area of 3-dpf embryos. Uninjected control embryos have an average of 151.3 DAPI-stained nuclei per F310+ cross-section area (n = 5), six1a morphants have 156.0 (n = 5), six1b morphants 135.2 (n = 6) and six1a/six1b double morphants 119.5 (n = 7). 3-dpf six1a/p53 morphants have an average number of 156 DAPI-stained nuclei per F310+ cross-section area (n = 4), six1b/p53 morphants 152.2 (n = 5), six1a/six1b/p53 triple morphants 119.3 (n = 4) and control embryos have 159.5 (n = 4). (D) Number of slow fibres per somite in 24-hpf and 3-dpf embryos. fb, fin bud; hh, hyohyoideus; ih, interhyoideus; ima, intermandibular anterior; imp, intermandibular posterior; om, ocular muscles; sh, sternohyoideus; som, somites. Cross-sections were made at somite number 10 for 24-hpf embryos, and at somite number 8 for 3-dpf embryos. *P<0.05, **P<0.01, ***P<0.001. Scale bars: 50μm.
Image
Figure Caption
Figure Data
Acknowledgments
This image is the copyrighted work of the attributed author or publisher, and
ZFIN has permission only to display this image to its users.
Additional permissions should be obtained from the applicable author or publisher of the image.
Full text @ J. Cell Sci.

