
Fig. 1
- ID
- ZDB-IMAGE-130607-7
- Genes
- Publication
- Matsuda et al., 2013 - Lef1 regulates Dusp6 to influence neuromast formation and spacing in the zebrafish posterior lateral line primordium
- All Figures
- Figures for Matsuda et al., 2013
|
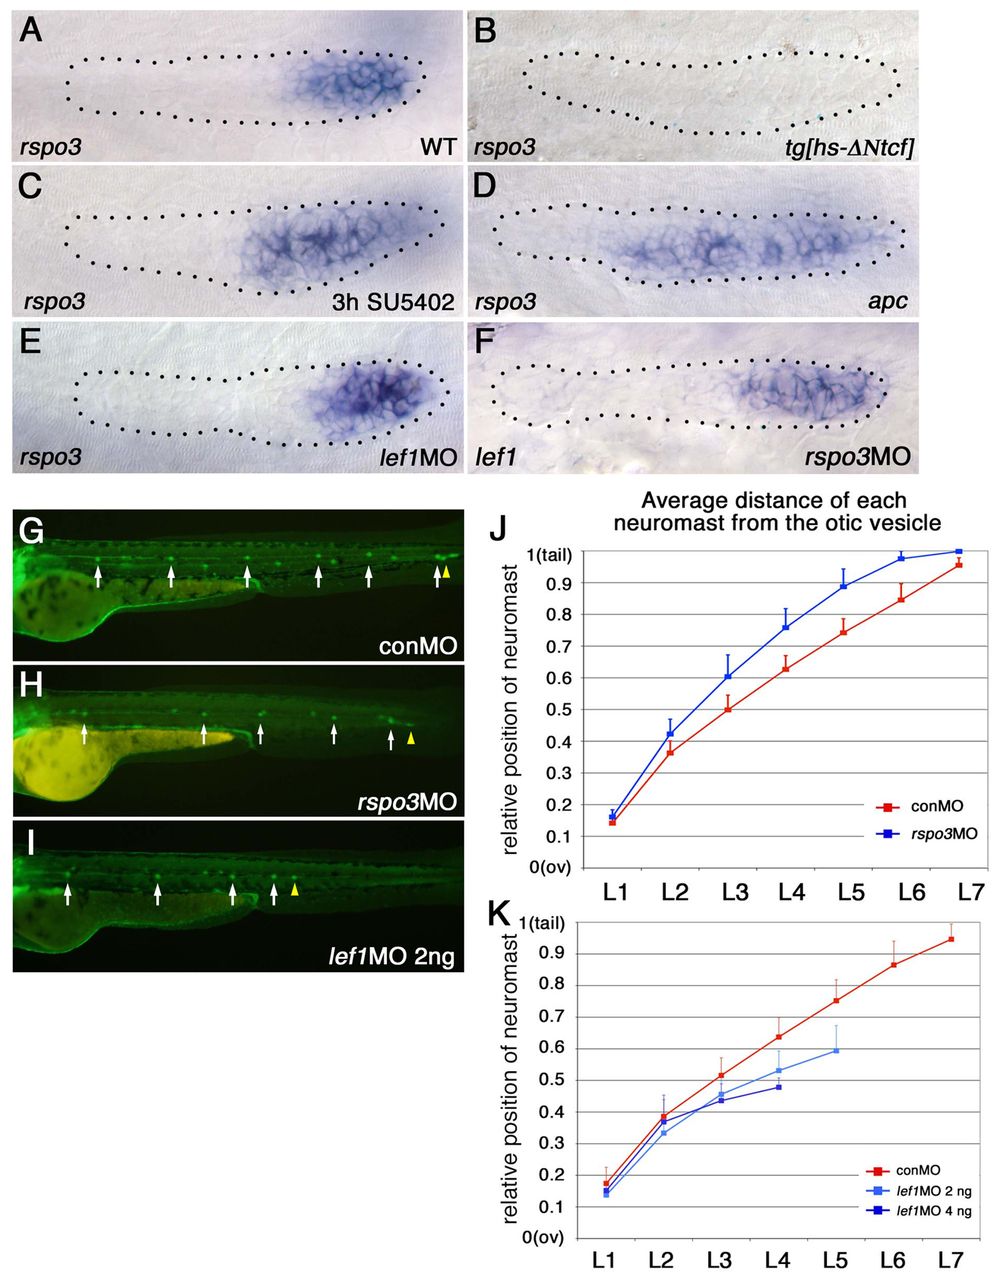
Fig. 1 Expression of rspo3 and lef1 is determined by similar mechanisms but knockdown of rspo3 and of lef1 have distinct effects on the pattern of neuromast deposition. (A-I) The leading end of the PLLp and caudal end of the zebrafish embryo are to the right. (A-F) The PLLp is outlined (dotted line). (A-D) Expression of rspo3 in the PLLp at 31 hpf. (A) rspo3 is expressed in the leading domain of the wild-type (WT) PLLp. (B) Heat shock-induced expression of a dominant-repressor form of TCF (ΔNTcf) inhibits rspo3 expression. (C,D) Exaggeration of Wnt activity, following inhibition of FGFR signaling with SU5402 (C) or in apc mutants (D), expands rspo3 expression toward the trailing domain. (E,F) rspo3 expression in the lef1 morphant PLLp (E) and lef1 expression in the rspo3 morphant PLLp (F) at 31 hpf. (G-K) The pattern of neuromast deposition in lef1 morphants and rspo3 morphants. (G-I) Neuromast deposition in tg[cldnb:lynGFP] embryos injected with lef1-MO, rspo3-MO or control-MO (conMO) at 48 hpf. White arrows indicate individual neuromasts and yellow arrowheads indicate PLLp termination. (J,K) Average position of each deposited neuromast in lef1 or rspo3 morphants relative to the distance from the otic vesicle (ov) to the tip of the tail. (H,J) Neuromasts are spaced further apart in rspo3 morphants. See supplementary material Fig. S4 for suppression of this phenotype by rspo3 mRNA co-injection. (I,K) Neuromasts are spaced closer together in lef1 morphants. Error bars indicate s.d.