
|
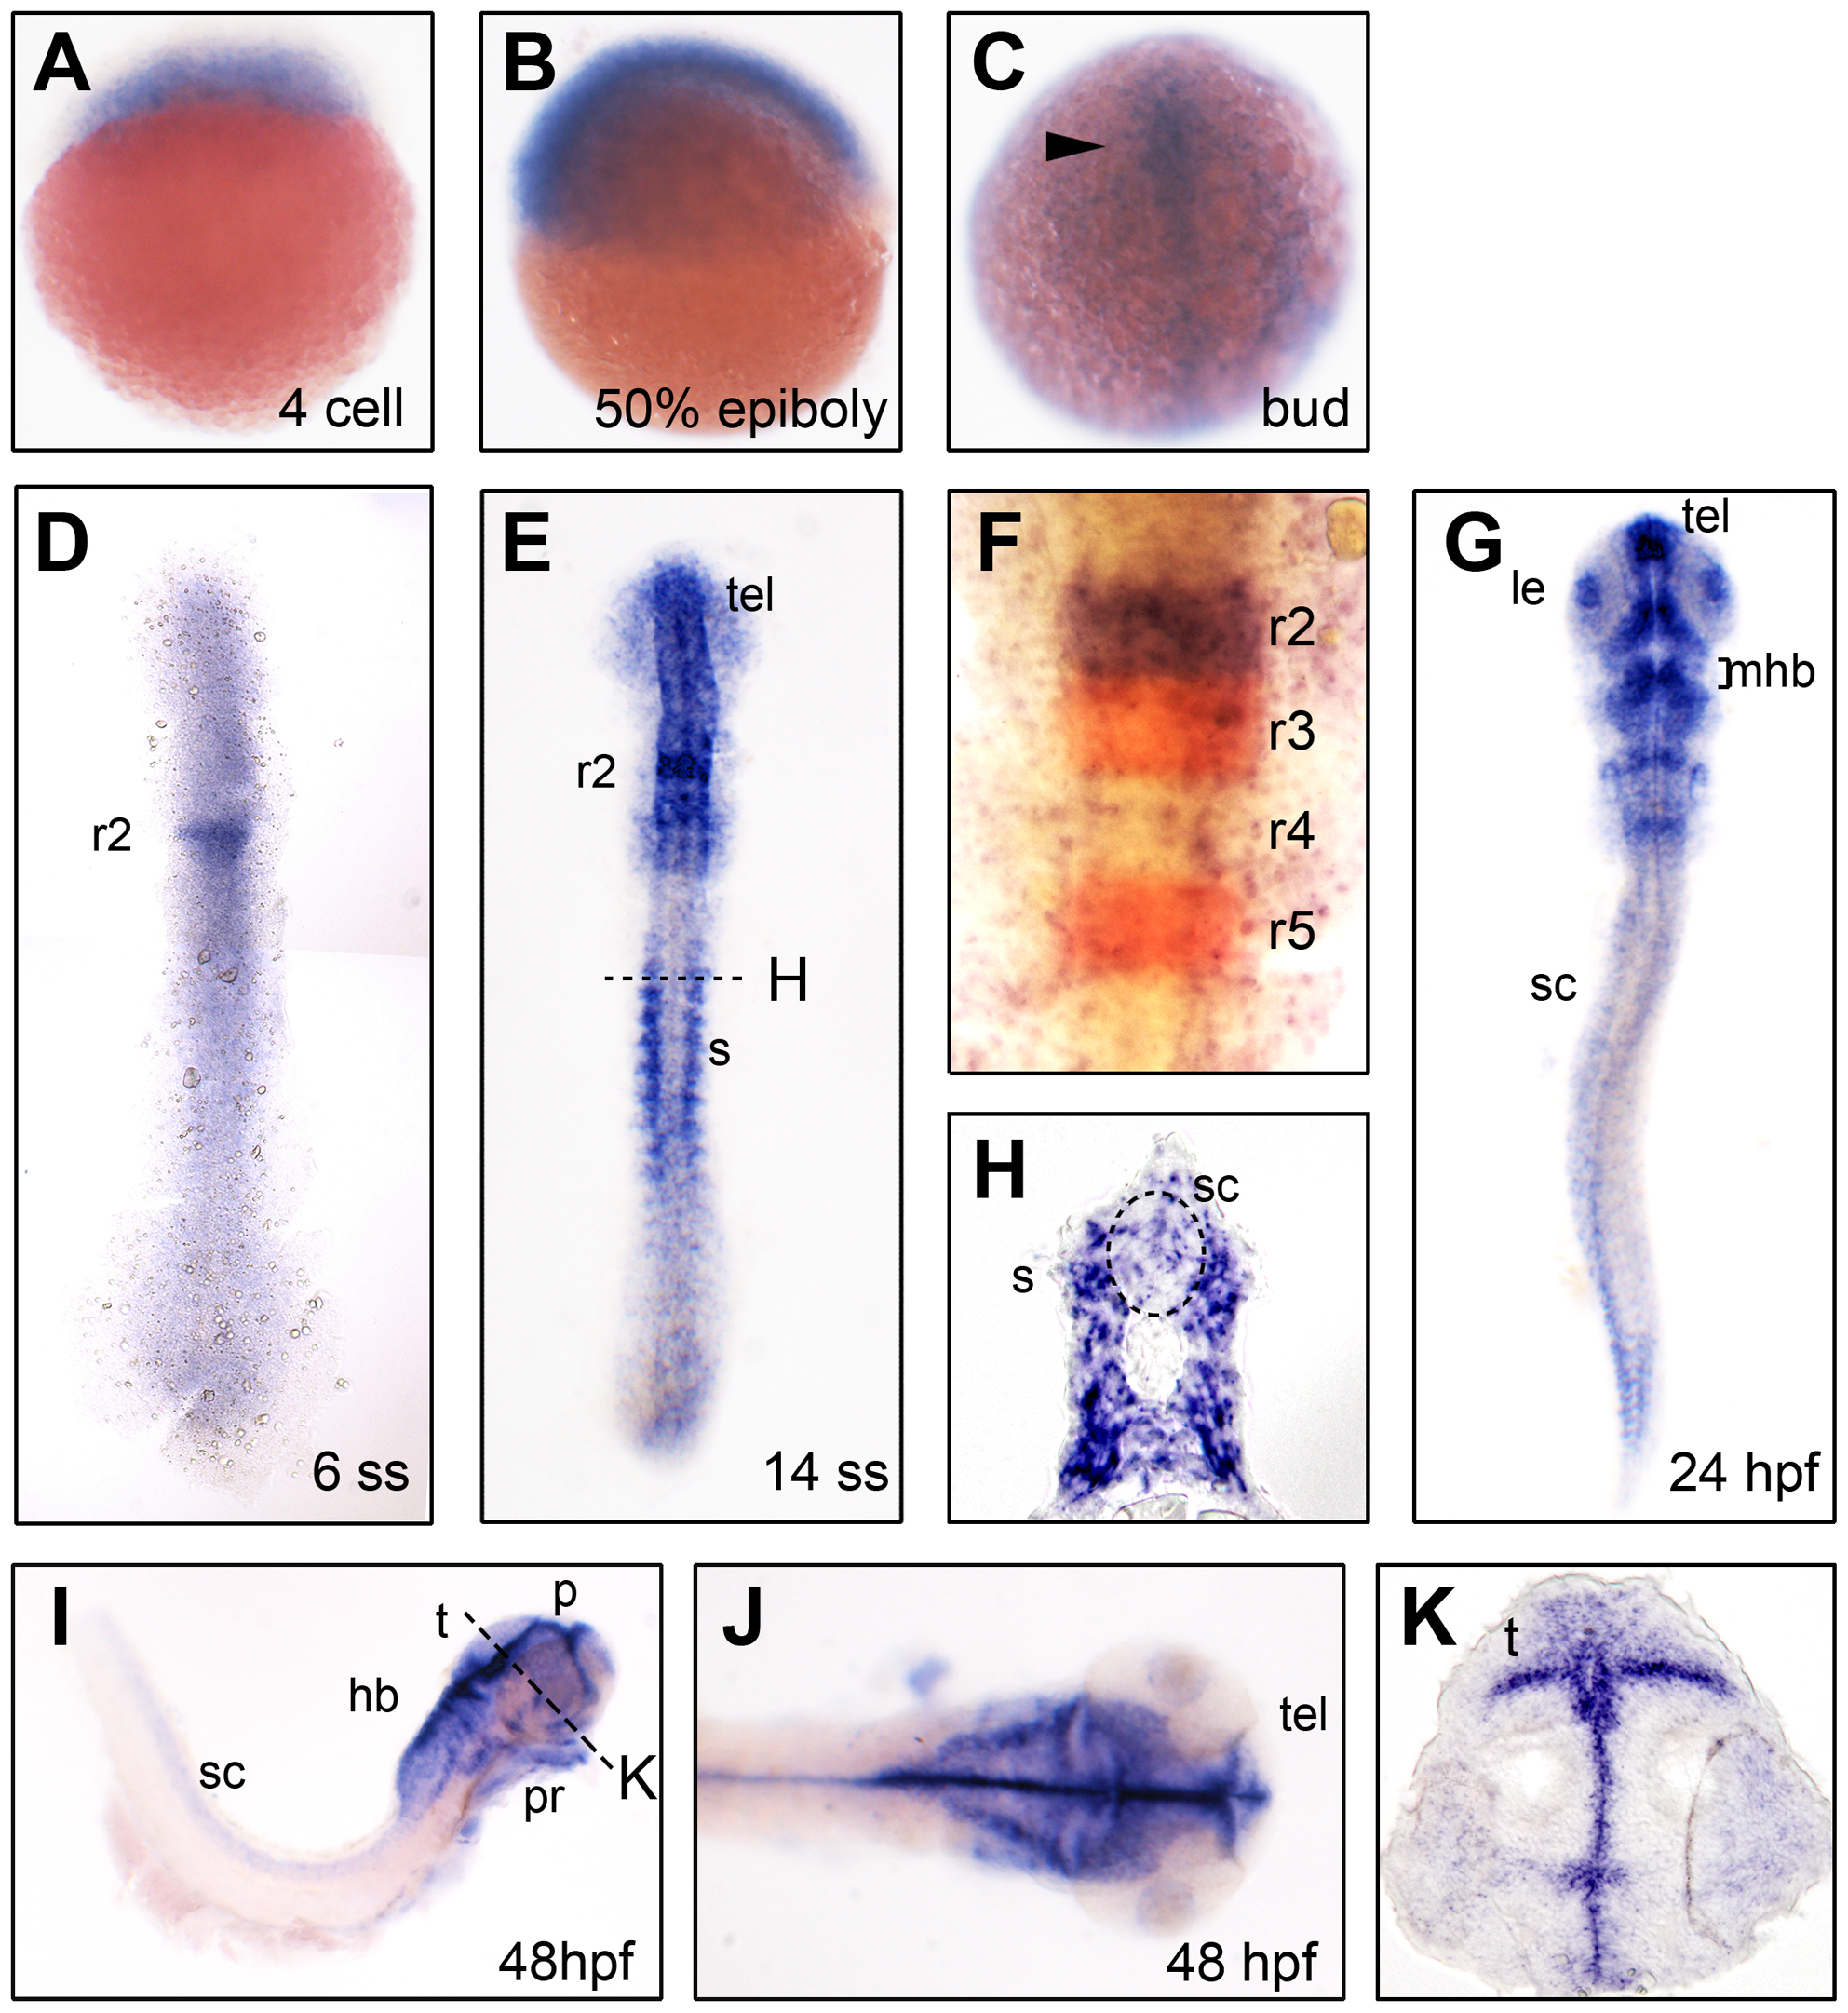
Fig. 1 akt1 expression in the developing zebrafish.
akt1 expression was detected by in situ hybridization in the developing nervous system during zebrafish embryogenesis. The embryo stages are shown in the bottom right corner of each panel. (C–F and G) Dorsal view with anterior to the top. (I) Lateral view with anterior to the right. (J) Dorsal view with anterior to the right. akt1 expression appears first in the developing nervous system during the bud stage (arrowhead in C) and later becomes restricted to specific brain areas (D–K). Relatively weak expression was detected in the spinal cord from the bud stage (C) and persisted until the final stage that was analyzed (48 hpf) (C–E and G–J). (F) akt1 expression (purple) in rhombomere 2 analyzed by double in situ hybridization with krox20 (red). H and K are cross-sections from E and I, respectively. hb, hindbrain; le, lens; mhb, midbrain-hindbrain boundary; p, pallium; pr, pharyngeal arches; r2–r5, rhombomere 2–5; s, somites; sc, spinal cord; t, tectum; tel, telencephalon.