
Fig. 6
- ID
- ZDB-IMAGE-130213-8
- Genes
- Publication
- Barreto-Valer et al., 2012 - Modulation by Cocaine of Dopamine Receptors through miRNA-133b in Zebrafish Embryos
- All Figures
- Figures for Barreto-Valer et al., 2012
|
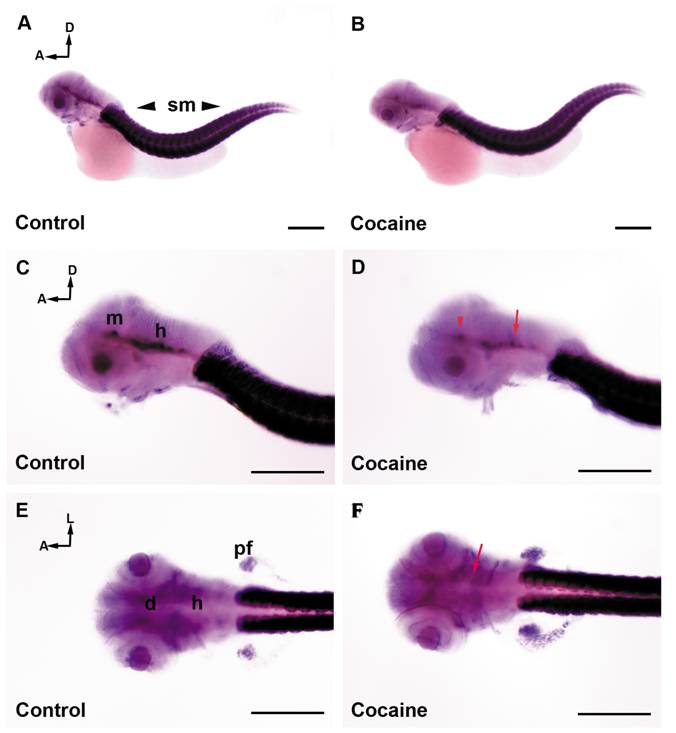
Fig. 6 miR-133b distribution in zebrafish embryos at 48 hpf by whole-mount in situ hybridization (ISH).
Control Group (A, C and E) and cocaine group (B, D and F). The expression of miR-133b is mostly found in the skeletal muscles (A, C and E) and to a lesser extent in the CNS (A, C and E). miR-133b is weakly expressed in the diencephalon, midbrain, and hindbrain. Embryos exposed to cocaine (B, D, and F) show a decrease mainly in the CNS (D), midbrain (red arrow head) and hindbrain (red arrow), while in the diencephalon (black arrow) the decrease less patent. The effect of cocaine on the expression of miR-133b in muscle is difficult to determine (D and F). Scale bars: 300 μm. A, B = 5X, and C, D, E, F = 10X. A: anterior; D: dorsal; L: lateral; d: diencephalon; m: midbrain; h: hindbrain; MHB: Midbrain Hindbrain Boundary; sm: skeletal muscle.