
Fig. 4
- ID
- ZDB-IMAGE-121203-4
- Genes
- Antibodies
- Publication
- Chen et al., 2012 - MANF regulates dopaminergic neuron development in larval zebrafish
- All Figures
- Figures for Chen et al., 2012
|
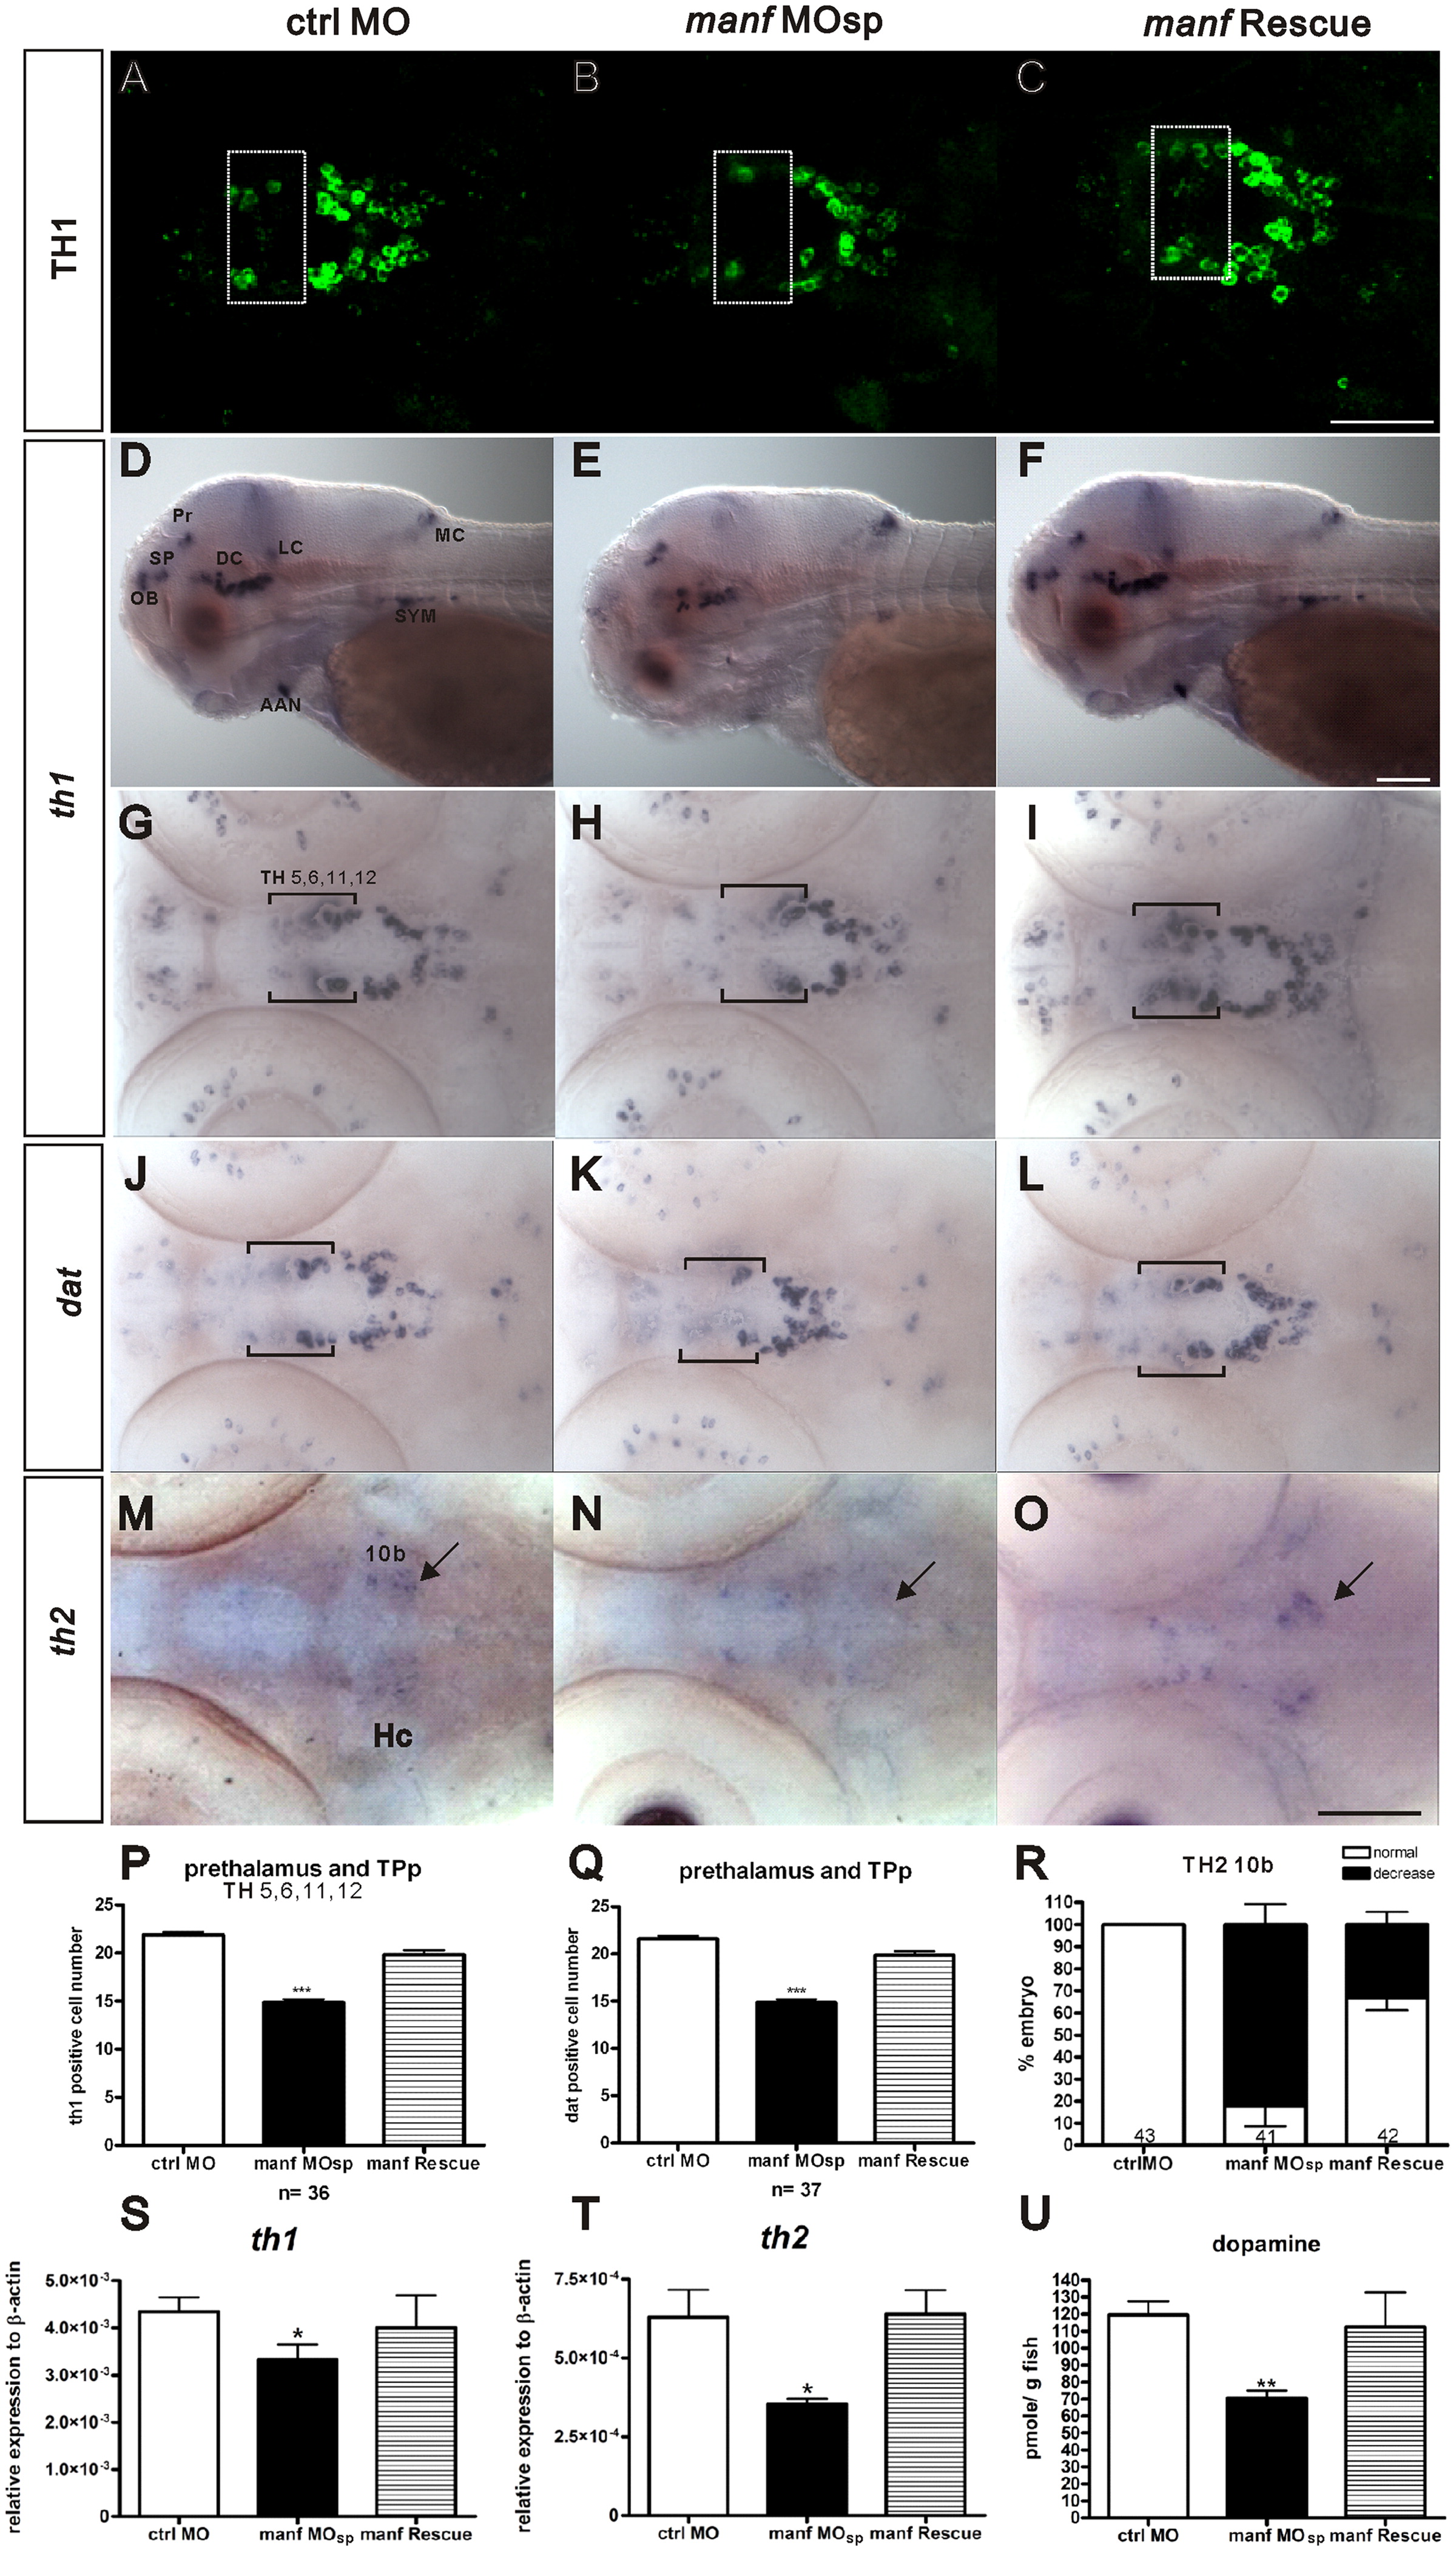
Fig. 4 Declines of gene expression of two tyrosine hydroxylases, dopamine transporter and dopamine level in manf MOsp morphants. Spatial distribution of th1, th2 and dat was revealed by whole mount in situ hybridization at 3 dpf control MO, manf MOsp and manf RNA rescued morphants. (A–C) A dorsal view of TH 1 immunohistochemistry. (D–F) A lateral view of th1 expression pattern. (G–I) A dorsal view of th1 expression pattern. (J–L) A dorsal view of dat expression pattern. (M–O) A dorsal view of th2 expression pattern. Quantitative analysis of the number of th1-containing cells (P) and dat-positive cells (Q) in prethalanus and TPp dopaminergic populations 5,6,11 and 12 defined by Sallinen et al., 2009b; DC1 and DC2 group defined by ( Rink and Wullimann, 2002 and Schweitzer et al., 2012). (R) The percentage of embryos with normal and decreased th2-positive signal (***p<0.001, one-way ANOVA with Dunnett′s test). (S–T) qPCR analysis of th1 and th2 transcript levels (*p<0.05, n=3, Student′s t test). (U) dopamine concentration measured by HPLC at 4 dpf (**p<0.01, n=4, Student′s t test). The frame shown in the G–L indicates the deficiency of th1 cell populations (TH1 populations 5,6,11 and 12) in a manf MOsp morphant. The arrow in M–O indicates the site of the deficiency of th2 cell population in caudal hypothalamus (Hc, group 10b) in a manf MOsp morphant. AAN: arch-associated neurons; DC: diencephalic catecholaminergic cluster; LC: locus coeruleus; MC: medulla catecholamergic cluster; OB: olfactory bulb. Pr: dorsal pretectum; Sym: sympathetic neurons; TPp: periventricular nucleus of posterior tuberculum. Scale bar=100 μm.
Reprinted from Developmental Biology, 370(2), Chen, Y.C., Sundvik, M., Rozov, S., Priyadarshini, M., and Panula, P., MANF regulates dopaminergic neuron development in larval zebrafish, 237-249, Copyright (2012) with permission from Elsevier. Full text @ Dev. Biol.