
Image
|
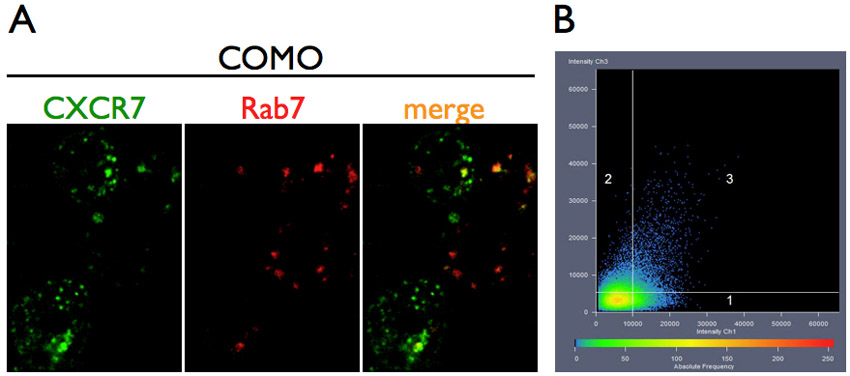
Figure Caption
Fig. S12
Quantification of colocalization of Cxcr7b with endosomal markers. (A) Representative images of cells co-expressing Cxcr7b and endosomal markers, Rab7 in this example, analyzed using the Zeiss ZEN colocalization module. (B) Colocalization scatter plot of gray intensity values for each pixel in ECFP (Cxcr7) and mCherry (Rab proteins)/DsRed (Lamp1) channels (1 and 2 represent ‘non-colocalizing’ pixels of each channel, 3 represents colocalization intensities). The intensity colocalization coefficient determined from such graphs was averaged among six independent measurements (1 measurement per embryo).
Acknowledgments
This image is the copyrighted work of the attributed author or publisher, and
ZFIN has permission only to display this image to its users.
Additional permissions should be obtained from the applicable author or publisher of the image.
Full text @ Development