
Fig. 7
- ID
- ZDB-IMAGE-120727-16
- Genes
- Publication
- Zhang et al., 2012 - RNF12 Controls Embryonic Stem Cell Fate and Morphogenesis in Zebrafish Embryos by Targeting Smad7 for Degradation
- All Figures
- Figures for Zhang et al., 2012
|
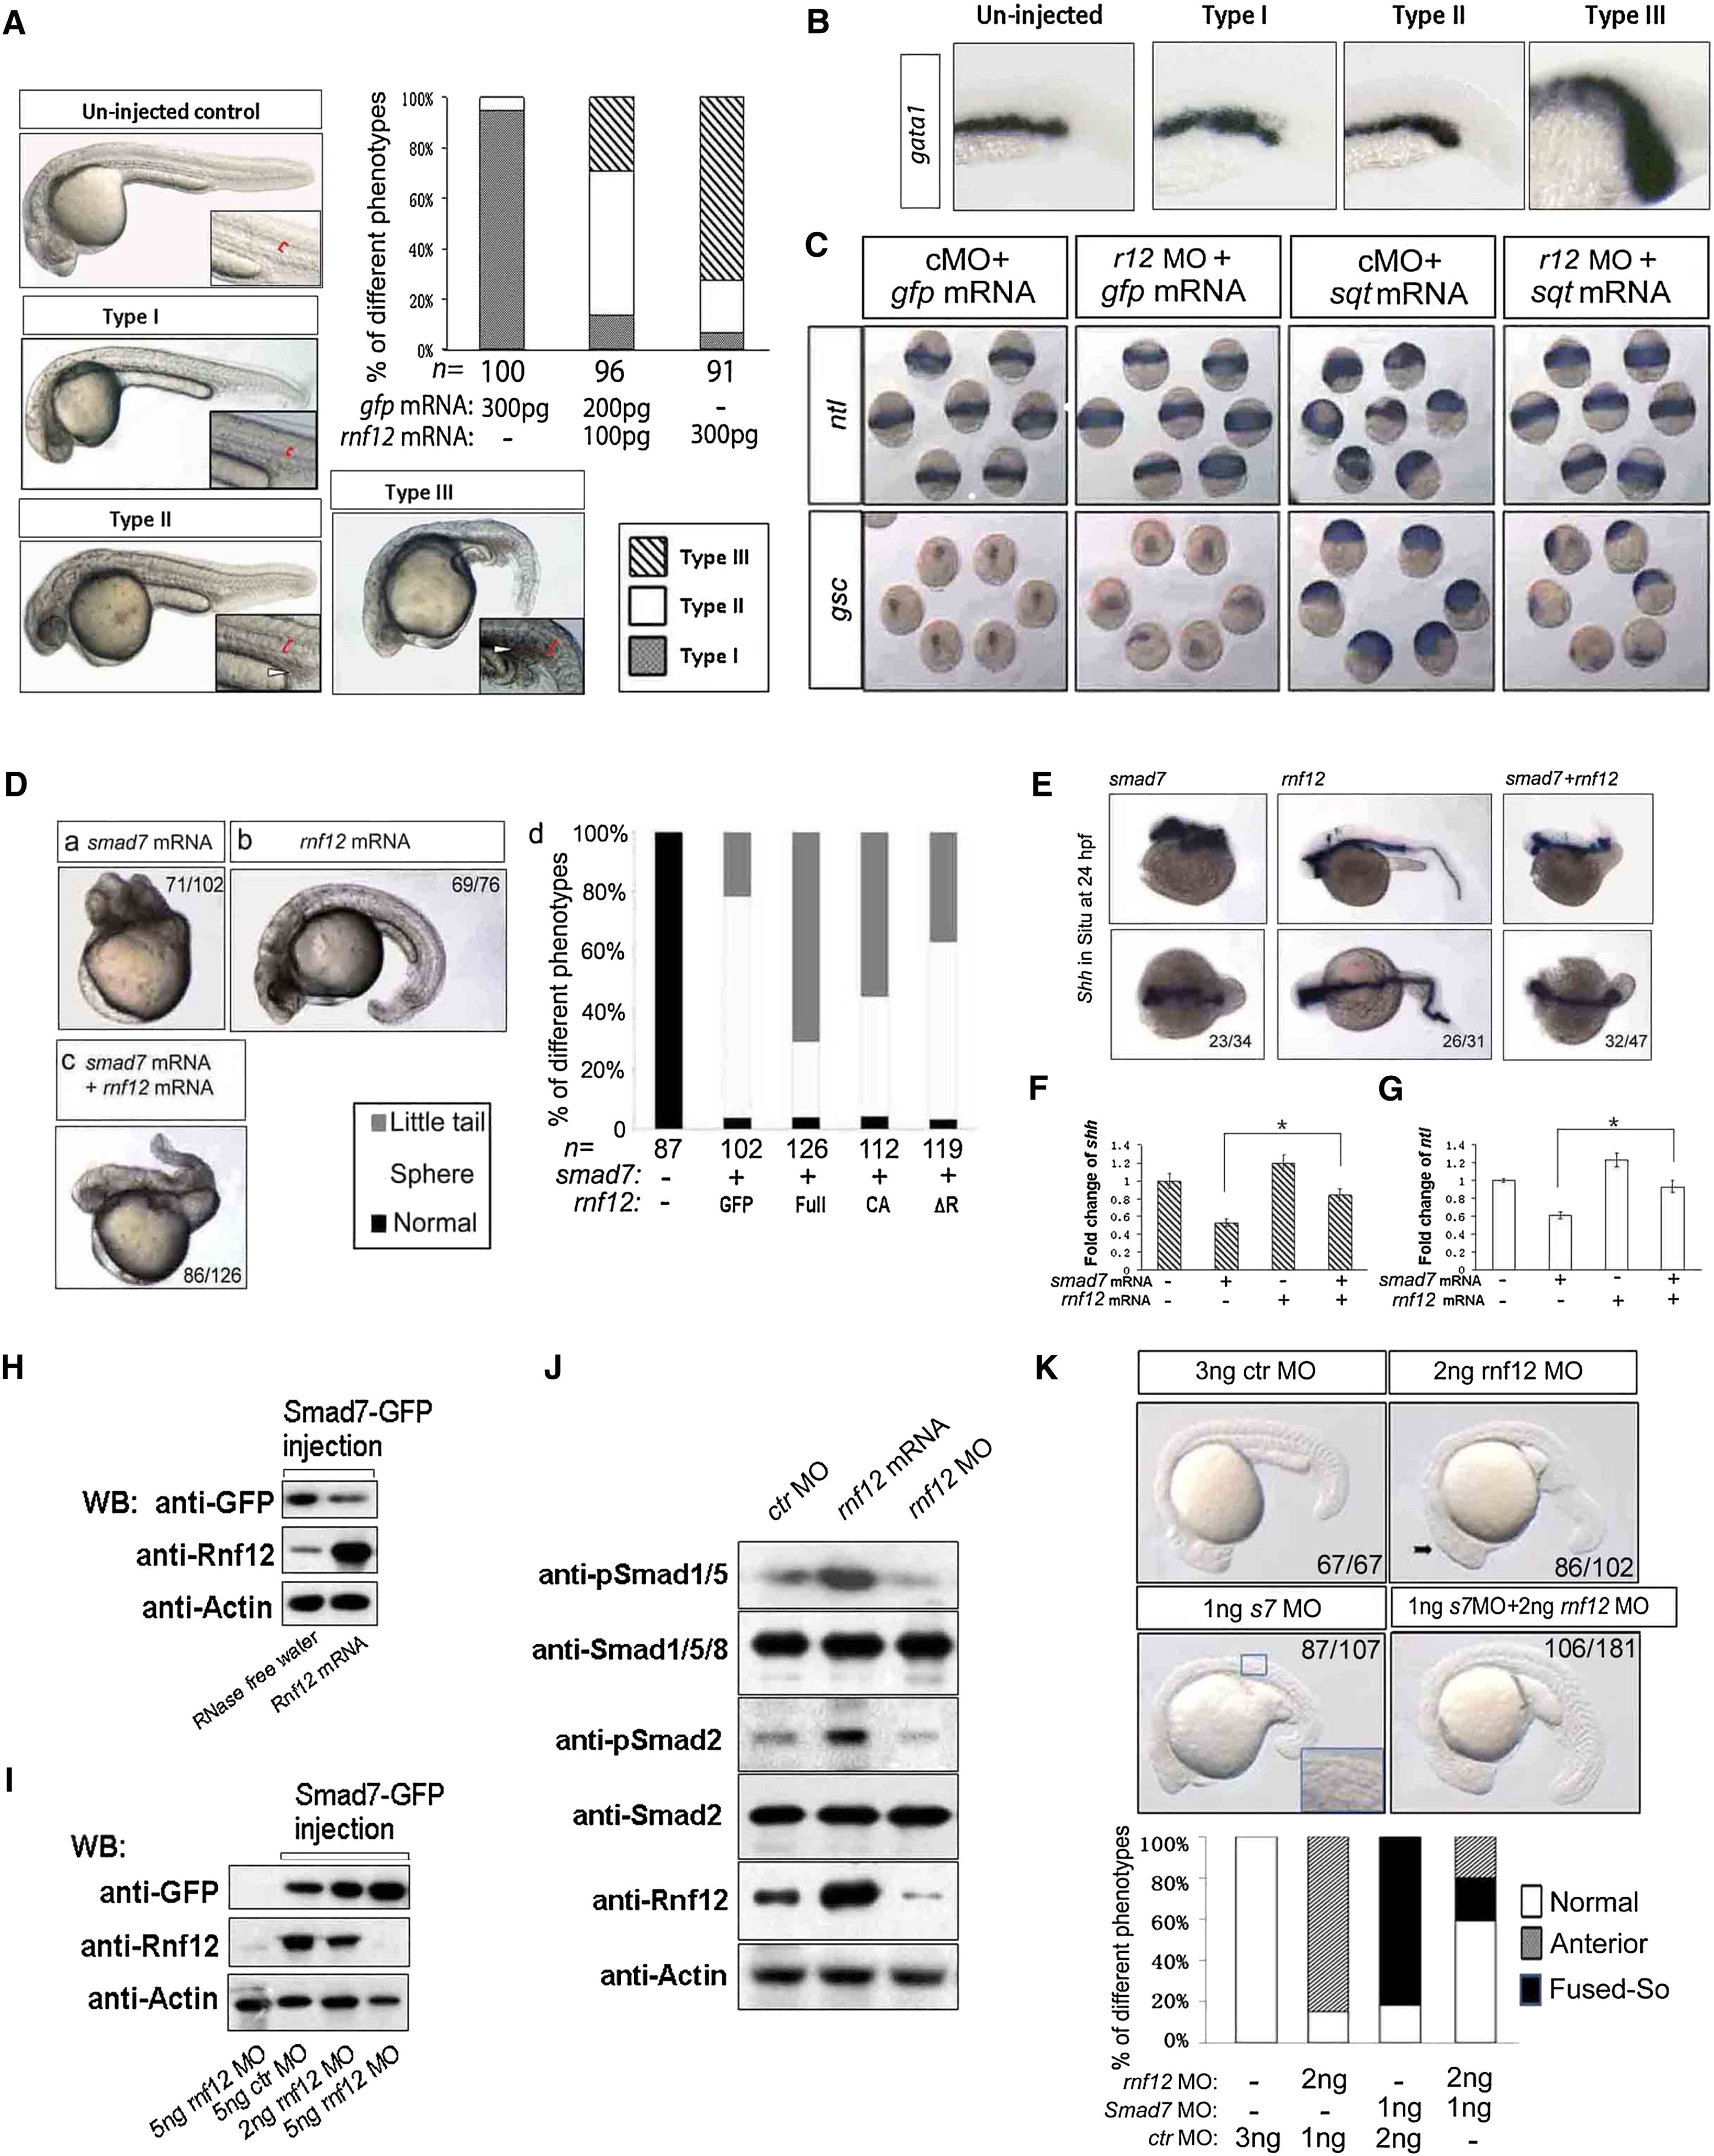
Fig. 7 Function of RNF12 in Zebrafish Embryos(A and B) Dose-dependent effects of overexpression of zRnf12. The phenotypes caused by zRnf12 overexpression included the following: type I, phenotype similar to wild-type embryo; type II, phenotype with a wider notochord and blood cell deposits; type III, phenotype with much more blood cells deposited. The red bracket represents the width of the notochord, and the white arrowhead indicates the deposited blood cells. The statistical values indicate the ratios of phenotypes in different groups of injected embryos. The underlined numbers indicate the total numbers of observed embryos. All embryos were observed at 25–26 hr postfertilization (hpf). (B) Dose-dependent induction of blood island caused by zRnf12 overexpression.(C) The expression patterns of no tail (ntl) and goosecoid (gsc) under conditions that caused zRnf12 knockdown (r12 MO) or/and squint (sqt) overexpression. All embryos are shown in the shield stage (middle gastrulation). All the embryo injections were carefully controlled with the same amount of control MO and control GFP mRNA.(D) (Da) The most common phenotype in zebrafish embryos injected with smad7 mRNA (200 pg); this phenotype was called “Sphere.” (Db) The phenotype caused by injecting zRnf12 mRNA. (Dc) Major phenotype in zebrafish embryos coinjected with smad7 and zRnf12 mRNAs; this phenotype was called "Little Tail." (Dd) The statistical ratios of phenotypes in embryos injected with different mRNAs and their combinations. All embryos were observed at 31 hpf with the head oriented to the left. The number of embryos showing the phenotype was indicated.(E) The shh expression pattern of the same types of embryos shown in (Da)–(Dc); (upper panel) the lateral view with the head oriented to the left; (lower panel) the dorsal view with the head oriented to the left. All embryos were fixed at 24 hpf. The number of embryos showing the phenotype is indicated.(F) Relative shh expression levels of the same types of embryos shown in (Da)–(Dc) as detected by qRT-PCR. Values and error bars represent the mean ±SD of triplicates and are representative of at least two independent experiments.(G) Relative ntl expression levels of the same types of embryos shown in (Da)–(Dc) as detected by qRT-PCR. Values and error bars represent the mean ±SD of triplicates and are representative of at least two independent experiments.(H and I) Western blotting for Smad7-GFP fusion protein levels affected by zRnf12 MO or ectopic expression of zrnf12.(J) Western blotting for endogenous Smad1/5/8 and Smad2 C-terminal phosphorylation levels affected by zrnf12 MO or zRnf12mRNA.(K) The knockdown of zebrafish smad7 can rescue rnf12 morphants phenotype. The statistical bars are listed on the right. All phenotypes were monitored at 22–24 hpf. Arrow indicated bigger head and anterior phenotype caused by rnf12 MO; Fused-So indicated fused-somite defect caused by smad7 MO. The injection dose for every embryo was 4 ng of the MO mixture (2 ng of MO1 and 2 ng MO2 pooled).