
IMAGE
Fig. 1
- ID
- ZDB-IMAGE-120601-1
- Genes
- Publication
- Yue et al., 2012 - Thrombin Receptor Regulates Hematopoiesis and Endothelial-to-Hematopoietic Transition
- All Figures
- Figures for Yue et al., 2012
Image
|
Figure Caption
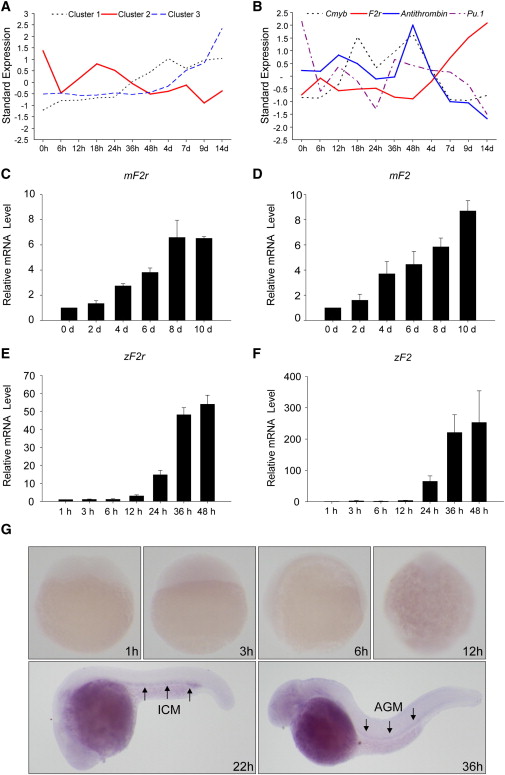
Fig. 1 F2r Is Significantly Upregulated during Hematopoiesis(A) Three distinct GPCR expression patterns during mESC differentiation.(B) Expression patterns of F2r, Antithrombin, Cmyb, and Pu.1 in the microarray data.(C–F) qPCR analyses of F2r and F2 expressions during mESC hematopoietic differentiation (C and D) and zebrafish embryogenesis (E and F).(G) WISH analyses of F2r expression pattern at different stages of zebrafish embryogenesis. Arrows indicate ICM region at 22 hpf and AGM region at 36 hpf.
Figure Data
Acknowledgments
This image is the copyrighted work of the attributed author or publisher, and
ZFIN has permission only to display this image to its users.
Additional permissions should be obtained from the applicable author or publisher of the image.
Reprinted from Developmental Cell, 22(5), Yue, R., Li, H., Liu, H., Li, Y., Wei, B., Gao, G., Jin, Y., Liu, T., Wei, L., Du, J., and Pei, G., Thrombin Receptor Regulates Hematopoiesis and Endothelial-to-Hematopoietic Transition, 1092-1100, Copyright (2012) with permission from Elsevier. Full text @ Dev. Cell