
Fig. 2
- ID
- ZDB-IMAGE-120216-101
- Genes
- Publication
- Van Otterloo et al., 2012 - Novel Tfap2-mediated control of soxE expression facilitated the evolutionary emergence of the neural crest
- All Figures
- Figures for Van Otterloo et al., 2012
|
Fig. 2
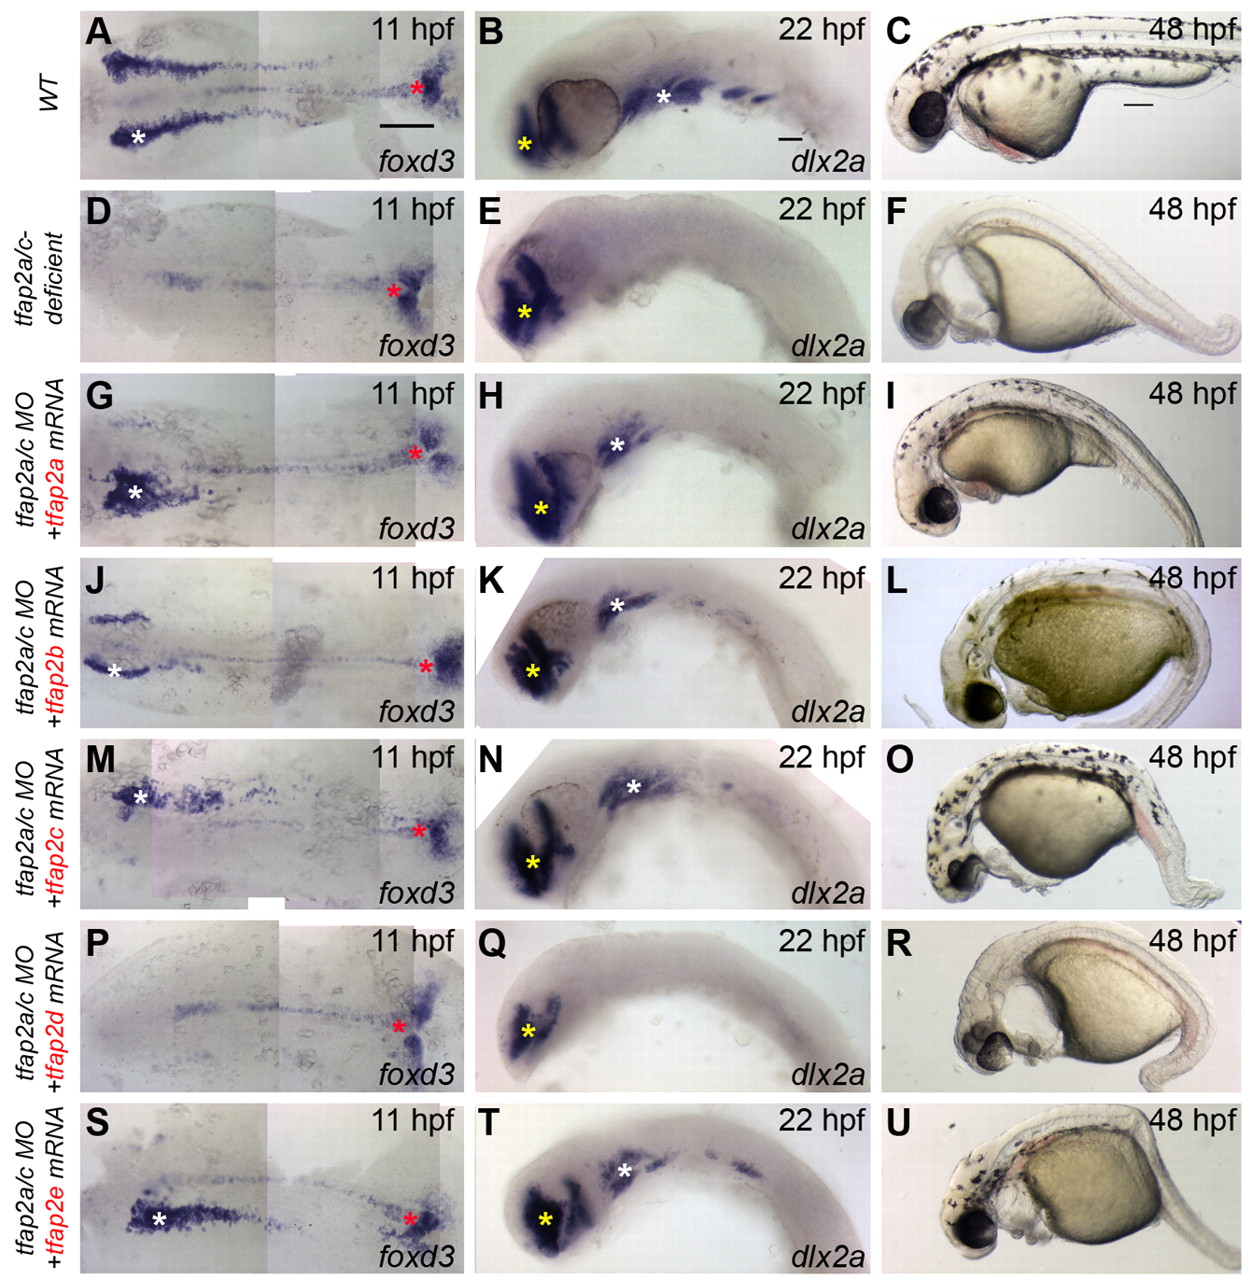
Assessment of the ability of gnathostome Tfap2 paralogs to restore neural crest in tfap2a/c-deficient zebrafish embryos. (A,D,G,J,M,P,S) Dorsal views of flat-mounted wild-type zebrafish embryos (A) or embryos injected with the indicated mRNA and/or MO (D,G,J,M,P,S), fixed at 11 hpf and processed to reveal foxd3 expression. Restored foxd3 expression was found on left, right, or both sides as a result of mosaic injection of mRNA. White asterisks indicate premigratory neural crest. Red asterisks indicate non-neural crest-derived tailbud. (B,E,H,K,N,Q,T) Lateral views of wild-type zebrafish embryos (B) or embryos injected with the indicated mRNA and/or MO (E,H,K,N,Q,T), fixed at 22 hpf and processed to reveal dlx2a expression. With the exception of tfap2d, no trend was seen in the spatial extent of dlx2a expression and the tfap2 paralog used. White asterisks indicate migratory neural crest. Yellow asterisks indicate brain. (C,F,I,L,O,R,U) Lateral views of live embryos at 48 hpf that are wild type (C) or tfap2a mutants injected with tfap2c MO (F,I,L,O,R,U), and injected with the indicated mRNA. Embryos shown with anterior to the left, unless otherwise indicated. Scale bars: in A, 100 μm for A,D,G,J,M,P,S; in B, 50 μm for B,E,H,K,N,Q,T; in C, 100 μm for C,F,I,L,O,R,U.