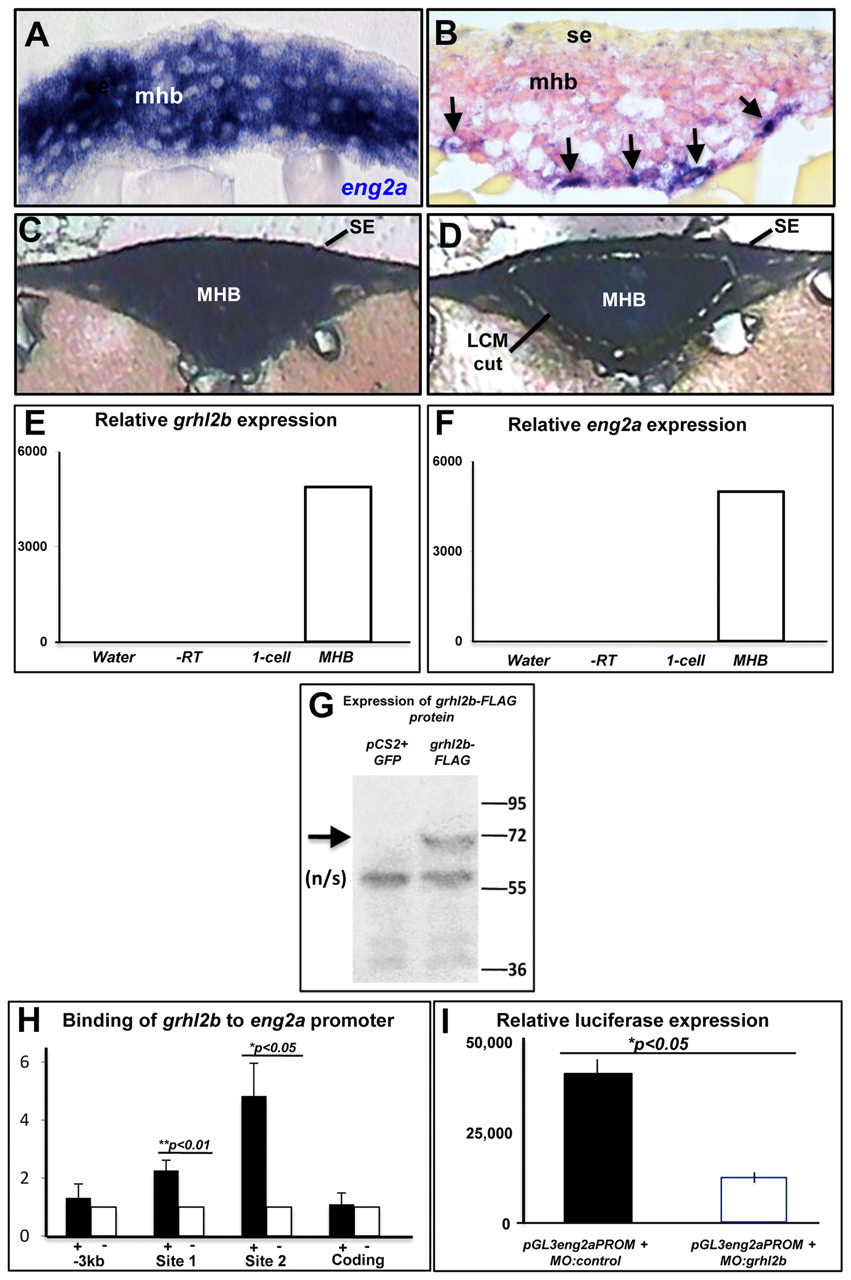
Fig. 4 eng2a is a direct target gene of grhl2b in the MHB. (A,B) High-powered coronal cross-sections, showing eng2a (A) and grhl2b (arrows) and pax2a (B) expression in the MHB in wild-type embryos at 12 hpf. mhb, midbrain-hindbrain boundary; se, surface ectoderm. (C,D) Coronal sections of MHB shown before laser capture microdissection (C) and highlighting the excised region (D). (E,F) Q-RT-PCR of grhl2b (E) and eng2a (F) from laser capture microdissection MHB tissue, relative to cDNA from pre-zygotic transcription-stage (one-cell) embryos, water and RT-negative controls. (G) Immunoblot of FLAG-tagged grhl2b (arrow) in cell extracts from HEK-293 cells transfected with pCS2+grhl2b-FLAG or the negative control (pCS2+GFP). n/s, non-specific band. (H) ChIP from embryos expressing FLAG-tagged grhl2b (+) or non-tagged grhl2b (–) using anti-FLAG antibody and primers for the two predicted grhl2b-binding sites in the eng2a promoter. Data are shown as the mean fold enrichment±s.e.m. (Q-RT-PCR) from two independent experiments performed with at least five embryos in each group. Negative control regions of the promoter or exon 1 (′–3 kb′ and ′coding′. respectively) show no significant enrichment. (I) Reporter gene assay using a 3 kb region of the eng2a promoter linked to the luciferase gene (pGL3-eng2a-PROM) in 24 hpf embryos co-injected with either MO:control or MO:grhl2b. Data are shown as mean light units±s.e.m. from two independent experiments performed with a minimum of 40 embryos in each group.
Image
Figure Caption
Figure Data
Acknowledgments
This image is the copyrighted work of the attributed author or publisher, and
ZFIN has permission only to display this image to its users.
Additional permissions should be obtained from the applicable author or publisher of the image.
Full text @ Development

