
Fig. 3
- ID
- ZDB-IMAGE-110421-2
- Genes
- Publication
- Fujimoto et al., 2011 - Identification of a Dopaminergic Enhancer Indicates Complexity in Vertebrate Dopamine Neuron Phenotype Specification
- All Figures
- Figures for Fujimoto et al., 2011
|
Fig. 3
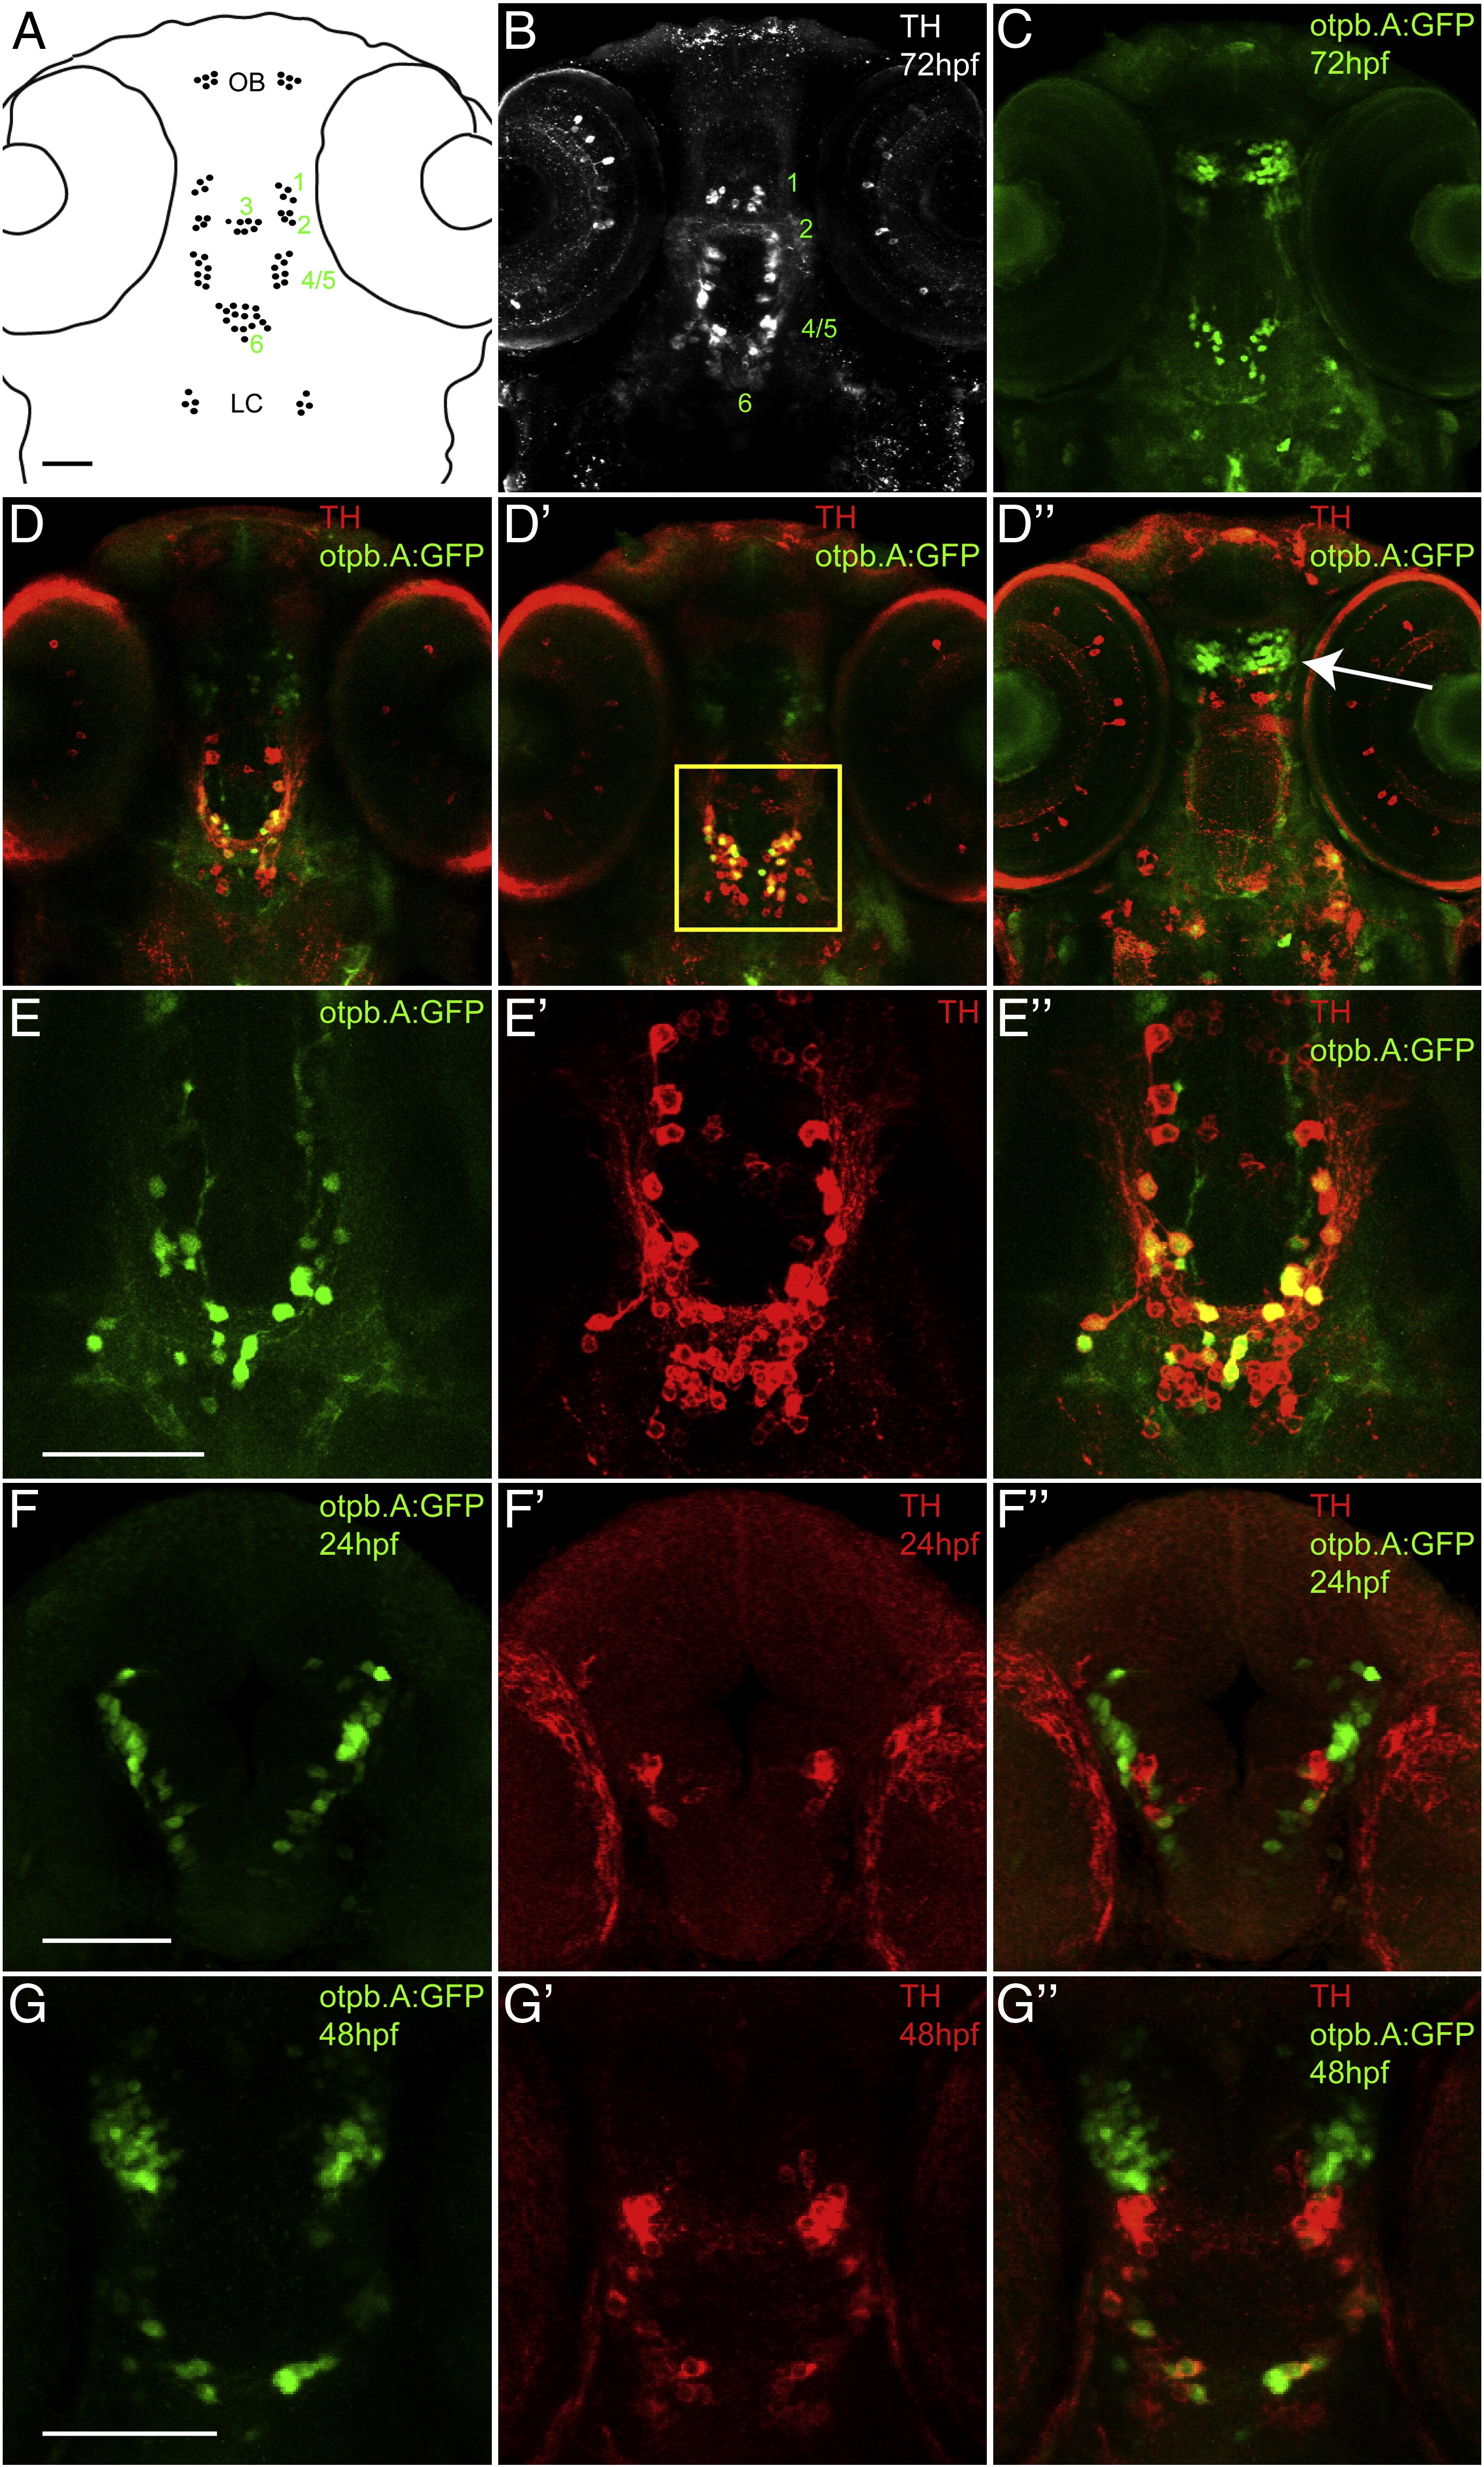
Characterization of Tg(otpb.A:egfp)zc48; confocal images of whole mount embryos double-labeled for GFP and for TH immunohistochemistry, ventral views, anterior to the top. Scale bar is 50 μm. (A) Schematic diagram of TH-positive cell groups in the zebrafish brain at 72 hpf, based on Rink and Wullimann (2002). (B) Confocal z-stack projection of TH immunohistochemistry at 72 hpf in the zebrafish brain. (C) Confocal z-stack projection of GFP immunohistochemistry in Tg(otpb.A:egfp)zc48. (D–D3) Confocal z-stack projections at different dorsal–ventral levels in the brain of Tg(otpb.A:egfp)zc48 at 72 hpf, showing co-expression of TH and GFP in diDA neuron groups 4 and 6, but not groups 1 and 2 (arrow); arrowhead points to the NPO neurons. (E–E3) Magnified views of the region boxed in B3, showing extensive overlap of GFP-positive neurons in the diencephalon with TH expression. (F–F3) Expression at 24 hpf. (G–G3) Expression at 48 hpf.
Reprinted from Developmental Biology, 352(2), Fujimoto, E., Stevenson, T.J., Chien, C.B., and Bonkowsky, J.L., Identification of a Dopaminergic Enhancer Indicates Complexity in Vertebrate Dopamine Neuron Phenotype Specification, 393-404, Copyright (2011) with permission from Elsevier. Full text @ Dev. Biol.