
IMAGE
Fig. 4
- ID
- ZDB-IMAGE-110221-13
- Publication
- Li et al., 2011 - Rack1 is required for Vangl2 membrane localization and planar cell polarity signaling while attenuating canonical Wnt activity
- All Figures
- Figures for Li et al., 2011
Image
|
Figure Caption
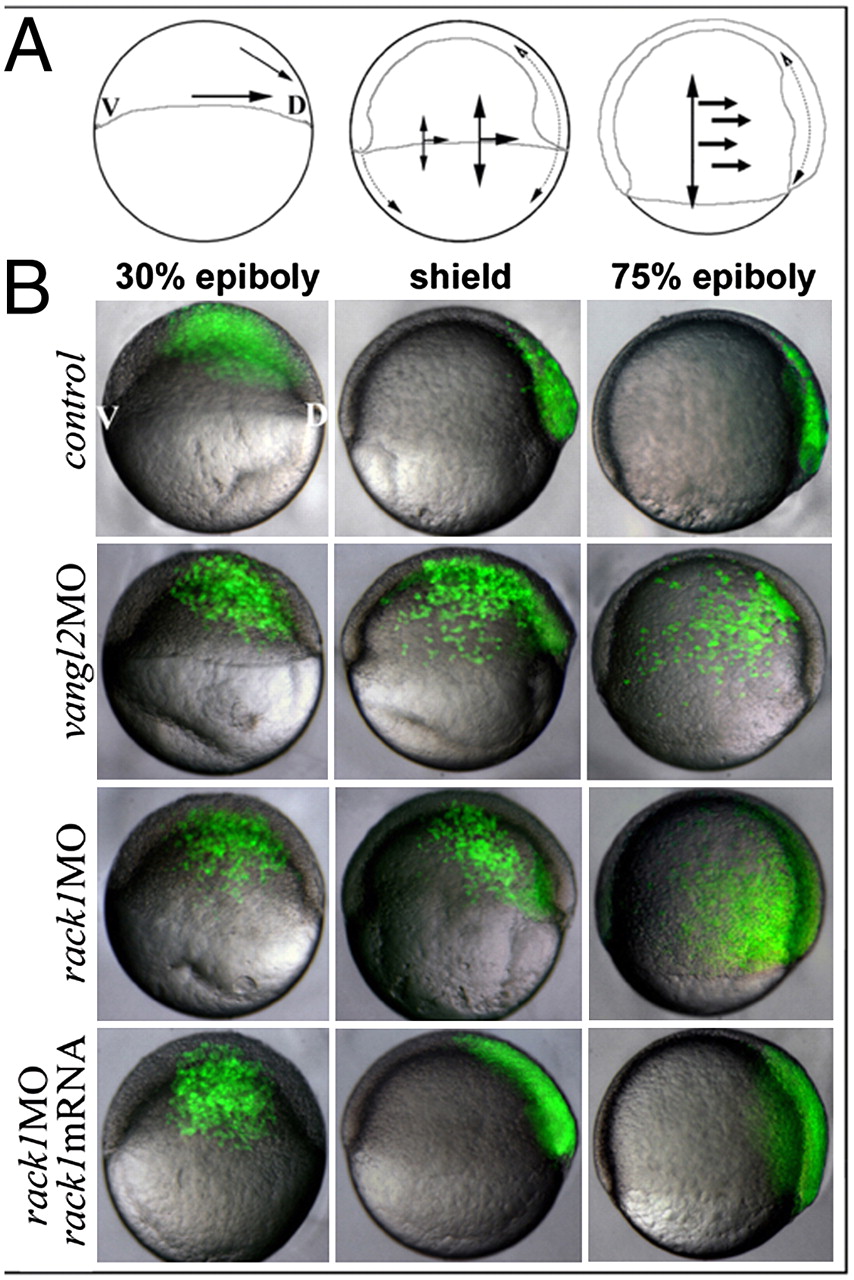
Fig. 4 Rack1 is required for CE during gastrulation. (A) The diagrams illustrate the directions of cellular movement during zebrafish gastrulation. (B) Images of live embryos injected with vangl2 MO, rack1 MO, or rack1 MO plus mouse rack1 mRNA and subsequently labeled single blastomere cell with fluorescein dextran at the 32-cell stage. V, ventral; D, dorsal.
Figure Data
Acknowledgments
This image is the copyrighted work of the attributed author or publisher, and
ZFIN has permission only to display this image to its users.
Additional permissions should be obtained from the applicable author or publisher of the image.
Full text @ Proc. Natl. Acad. Sci. USA