
Fig. 5
- ID
- ZDB-IMAGE-101223-17
- Genes
- Antibodies
- Publication
- Santoriello et al., 2010 - Kita Driven Expression of Oncogenic HRAS Leads to Early Onset and Highly Penetrant Melanoma in Zebrafish
- All Figures
- Figures for Santoriello et al., 2010
|
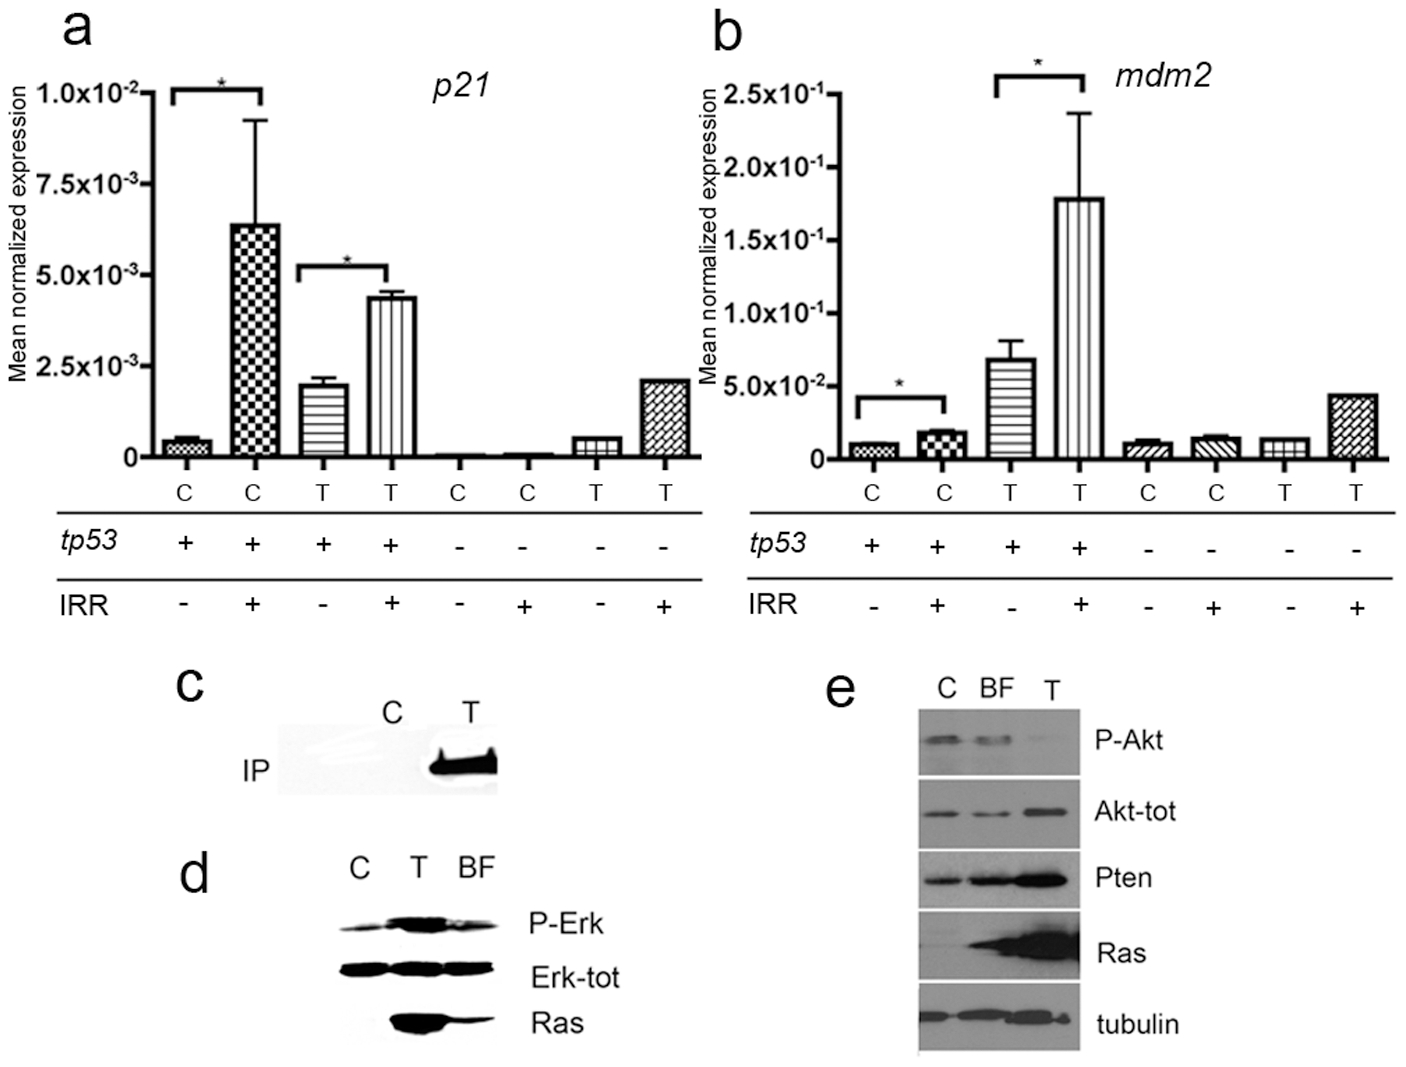
Fig. 5 kita-GFP-Ras tumors have a robust p53 pathway activation.
a–b) QPCR analysis of tp53 target gene expression. p21(a) and mdm2 (b) mRNA expression in control (C) or tumors from kita-GFP-RAS transgenic fish (T) with a wild-type (tp53+) or mutant (tp53 -) background genotype, as indicated. Samples were subjected to X-ray irradiation (IRR +) or left unirradiated (IRR -). All data are expressed as Mean Normalized Expression and were normalized to the expression levels of β-actin as an endogenous control. Error bars indicate s.d. except for tp53-/-, for which the error bars indicate range. n = 3 for C tp53+, IRR-; n = 3 for C tp53+, IRR+; n = 9 for T tp53+, IRR-; n = 3 for tp53+, IRR+; n = 2 for C tp53- IRR-; n = 2 for C tp53- IRR+; n = 1 for T tp53- IRR-; n = 1 for T tp53- IRR+. c-e) RAS pathway activation in tumor. c) Protein extracts from control and fin with tumor show active ras (Ras-GTP, immunoprecipitated with Raf1). Western Blot analysis of protein extracts prepared from control (C), fin with tumor (T) and black fin (BF) show an increased phosphorylation of ERK1/2 (d) and increased amounts of total AKT, but not phospho-AKT, which correlates with an increase in PTEN levels (e).