
Fig. 4
- ID
- ZDB-IMAGE-100806-166
- Genes
- Publication
- Herrgen et al., 2010 - Intercellular Coupling Regulates the Period of the Segmentation Clock
- All Figures
- Figures for Herrgen et al., 2010
|
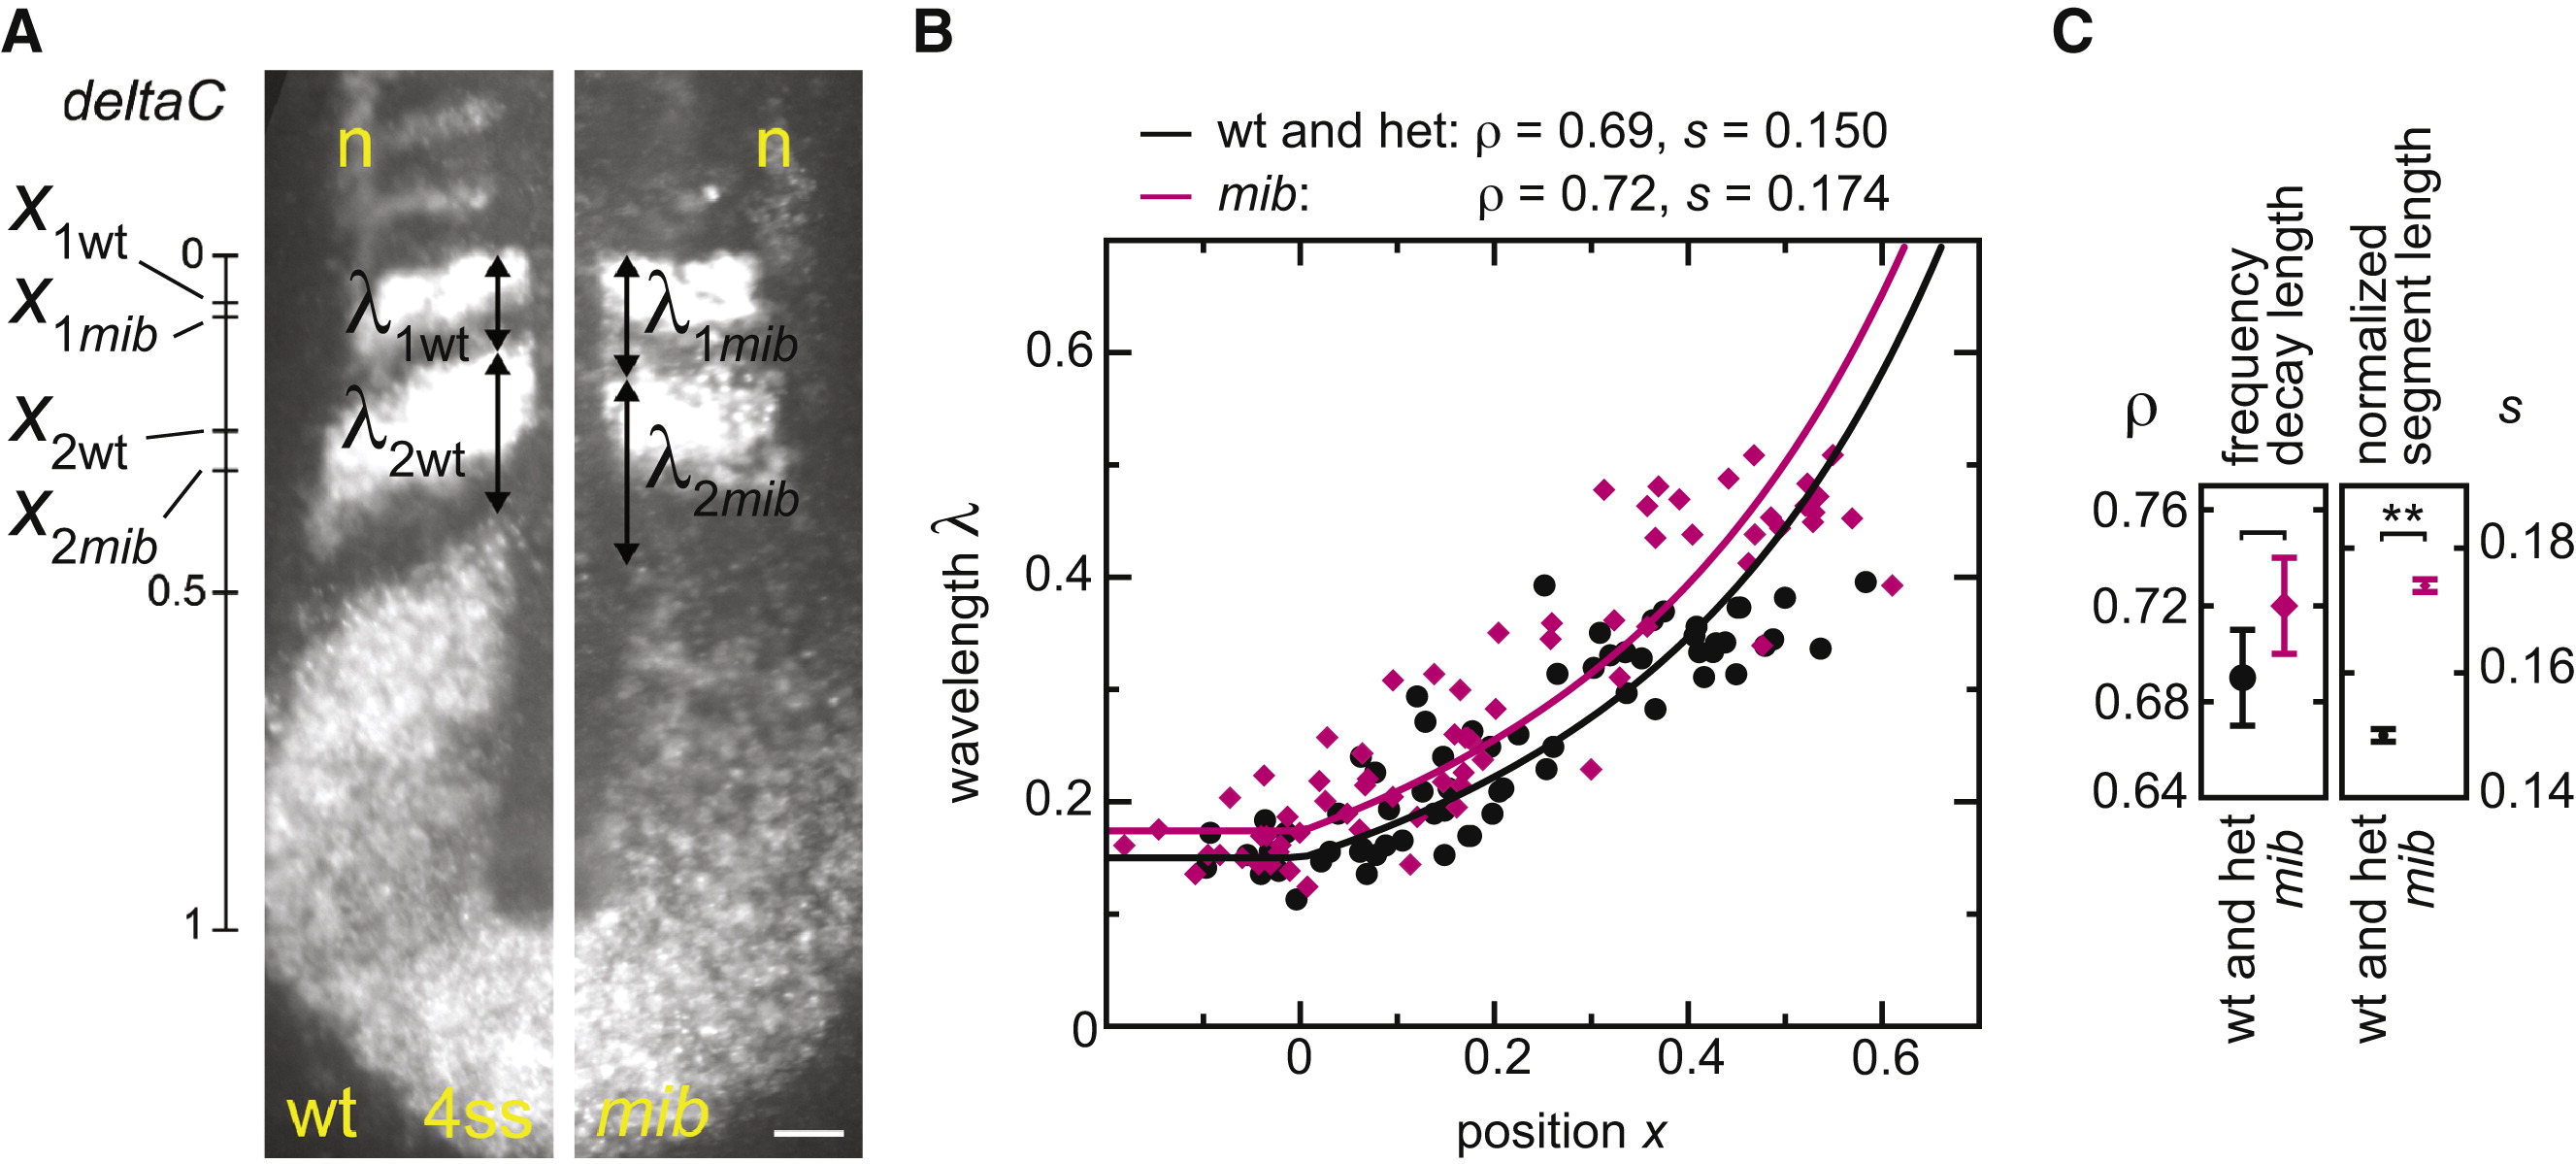
Fig. 4 Determination of Segmentation Clock Collective Period from Oscillating Gene Expression Patterns
(A) In situ hybridization: deltaC and isl1 (interneurons and Rohon-Beard neurons, n) in representative wild-type and mib embryos. The scale bar represents 50 μm.
(B) Measurements of normalized gene expression wavelength λ and position x; wild-type is black and mib is pink. Data points: n (wt) = 65, 28 embryos, n (mib) = 70, 28 embryos, two independent trials. Curves indicate fit of Equation 3 to data (Experimental Procedures).
(C) Values of frequency profile decay length ρ, and normalized segment length s parameters from the fit to the data. Error bars show 95% CI from bootstrap analysis (Supplemental Experimental Procedures 2.2.5). **p < 0.001, Student′s t test.