
Fig. 7
- ID
- ZDB-IMAGE-100603-25
- Genes
- Antibodies
- Publication
- Deacon et al., 2010 - The miR-143-adducin3 pathway is essential for cardiac chamber morphogenesis
- All Figures
- Figures for Deacon et al., 2010
|
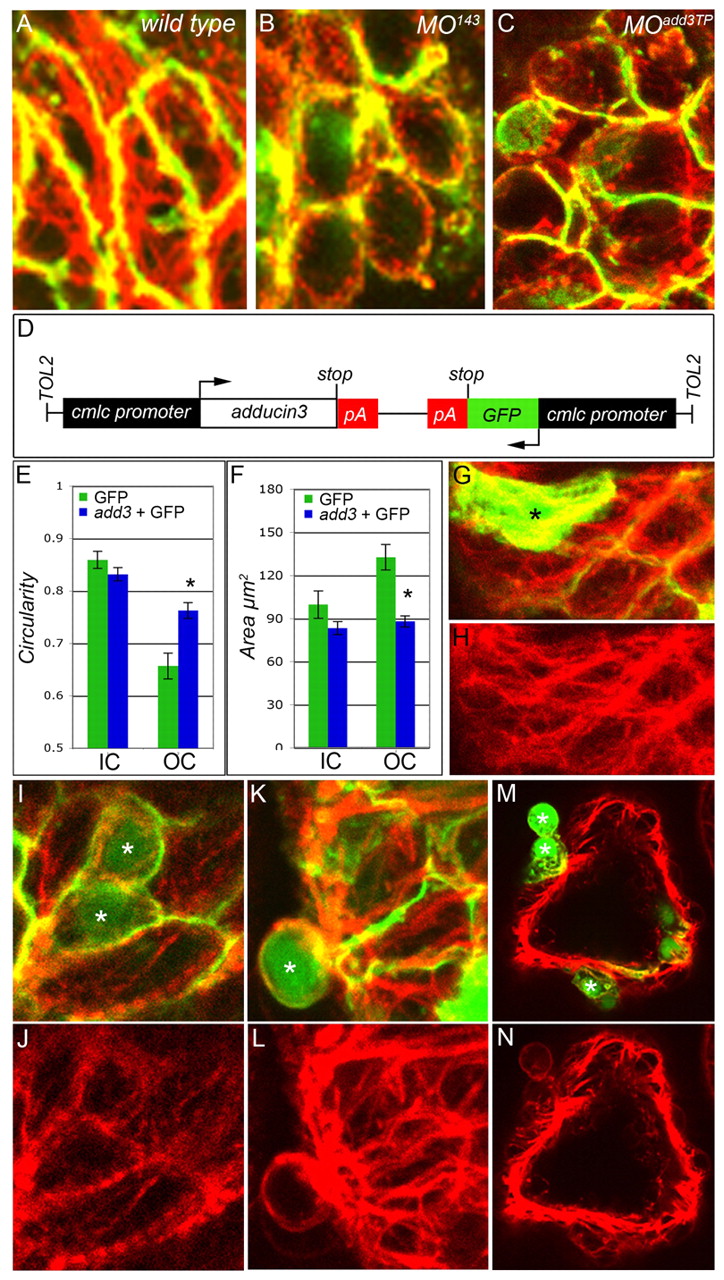
Fig. 7 Add3 functions cell-autonomously to affect F-actin localization. (A-C) Flattened z-stacks showing phalloidin (red) and anti-DM-GRASP (green) labeling of 48 hpf WT, MO143 and MOadd3TP zebrafish cardiomyocytes within the OC. (D) The construct used to overexpress GFP and add3 (no 3′ UTR). (E,F) Cell circularity (E) and area (F) in mosaic hearts. Add3-overexpressing OC myocytes are statistically more circular (blue bar) than OC CMs labeled with GFP alone (green bar). *, P=0.00045. Error bars represent ± s.e.m. (G-N) Samples of the raw data used to generate the bar charts in E and F. Asterisks indicate GFP+ cells. (G-L) Head-on view of the ventricular OC. (M,N) Cross-section through the ventricle. (G) Merged confocal image showing WT GFP+ cells (green) and F-actin distribution (red). (H) Same image as in G but showing phalloidin staining alone. Abundant intracellular F-actin fibers can be seen in elongated GFP+ OC cells. (I,K,M) Merged confocal images showing add3-overexpressing GFP+ cells (green) and F-actin distribution (red). (J,L,N) The same images as in I,K,M but showing phalloidin staining alone. (I,J) Intracellular fibers are more visible in elongated WT cells than in add3-overexpressing neighbors (green). (K-N) Approximately half of the add3-overexpressing cells are extruded from the ventricular wall and show obvious cortical F-actin localization as compared with their WT (GFP-) neighbors.