
Fig. 3
- ID
- ZDB-IMAGE-100223-36
- Publication
- Raeker et al., 2010 - Targeted deletion of the zebrafish obscurin A RhoGEF domain affects heart, skeletal muscle and brain development
- All Figures
- Figures for Raeker et al., 2010
|
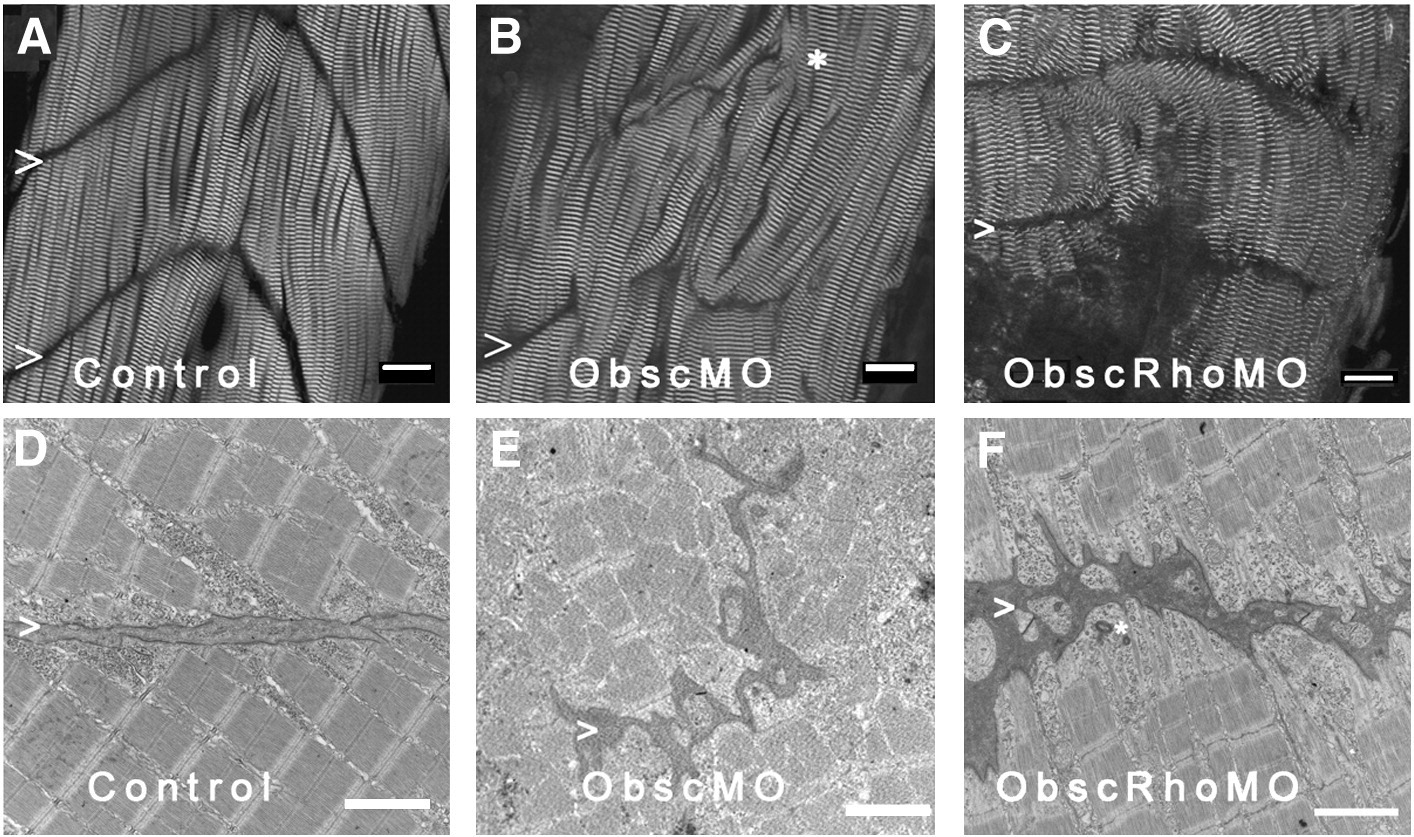
Fig. 3 Architecture of the myotendinous junction (MTJ). Confocal analysis using α-actinin (a Z disk component) immunolabeling (A–C) to assess myofibril morphology and ultrastructural analysis (D–F) to define the architecture of the MTJ was performed in control (A, D), obscurin A morphant (B, E) and obscurin A RhoGEF morphant (C, F) embryos at 72 hpf. In control embryos, the skeletal myocytes are aligned in parallel and the myotendinous junctions are well defined (A, D: >). The skeletal myocytes in obscurin A (ObscMO) morphant embryos vary in length and in their relationship to each other (∗) with elongated myocytes extending past very rudimentary somite boundaries (B, E: >). When compared to the ObscMO embryos, the obscurin A RhoGEF (ObscRhoMO) morphant embryos demonstrate a more consistent relationship between adjacent myocyte (more uniform parallel arrangement) and normal positioning of a complete or nearly complete somite boundary (C,F: >). However, the boundary is not sharply defined as in control embryos and often appears electron dense and irregular, not unlike the rudimentary boundaries/MTJs noted in ObscMO embryos. Scale bars are 20 μm (A–C) and 2 μm (D–F).
Reprinted from Developmental Biology, 337(2), Raeker, M.O., Bieniek, A.N., Ryan, A.S., Tsai, H.J., Zahn, K.M., and Russell, M.W., Targeted deletion of the zebrafish obscurin A RhoGEF domain affects heart, skeletal muscle and brain development, 432-443, Copyright (2010) with permission from Elsevier. Full text @ Dev. Biol.