
Fig. 2
- ID
- ZDB-IMAGE-090306-37
- Genes
- Publication
- Matthews et al., 2009 - TNF{alpha}-dependent hepatic steatosis and liver degeneration caused by mutation of zebrafish s-adenosylhomocysteine hydrolase
- All Figures
- Figures for Matthews et al., 2009
|
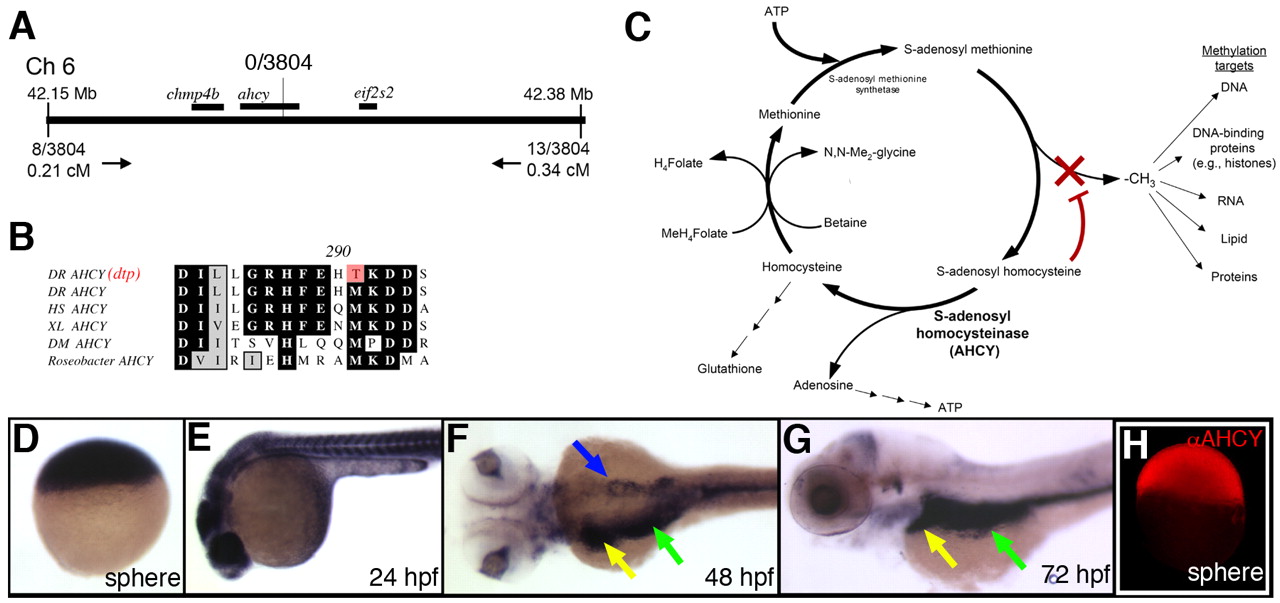
Fig. 2 Identification of ahcy as the dtp gene. (A) Schematic of the zebrafish dtp locus. The nearest polymorphic markers are indicated, with corresponding numbers of recombinants and calculated genetic distances. (B) Deduced amino acid sequence near the ahcy mutation identified in dtp larvae (indicated in red; DR, Danio rerio), with corresponding amino acid sequence of orthologous Ahcy proteins from Homo sapiens (HS), Xenopus laevis (XL), Drosophila melanogaster (DM) and Roseobacter. (C) Schematic of the methionine metabolism pathway. Reduced Ahcy activity is predicted to increase levels of SAH, which inhibits methyltransferases. (D-G) ahcy expression in staged zebrafish embryos and larvae. Ubiquitous expression is evident through 24 hpf. Expression at 48 hpf and 72 hpf is restricted to the liver (yellow arrow), intestine (green arrow) and pancreas (blue arrow). (H) Immunostaining at sphere stage, showing ubiquitous immunoreactive Ahcy protein.