
Fig. 2
- ID
- ZDB-IMAGE-081107-14
- Genes
- Antibodies
- Publication
- Sakaguchi et al., 2008 - Endothelial Signals Modulate Hepatocyte Apicobasal Polarization in Zebrafish
- All Figures
- Figures for Sakaguchi et al., 2008
|
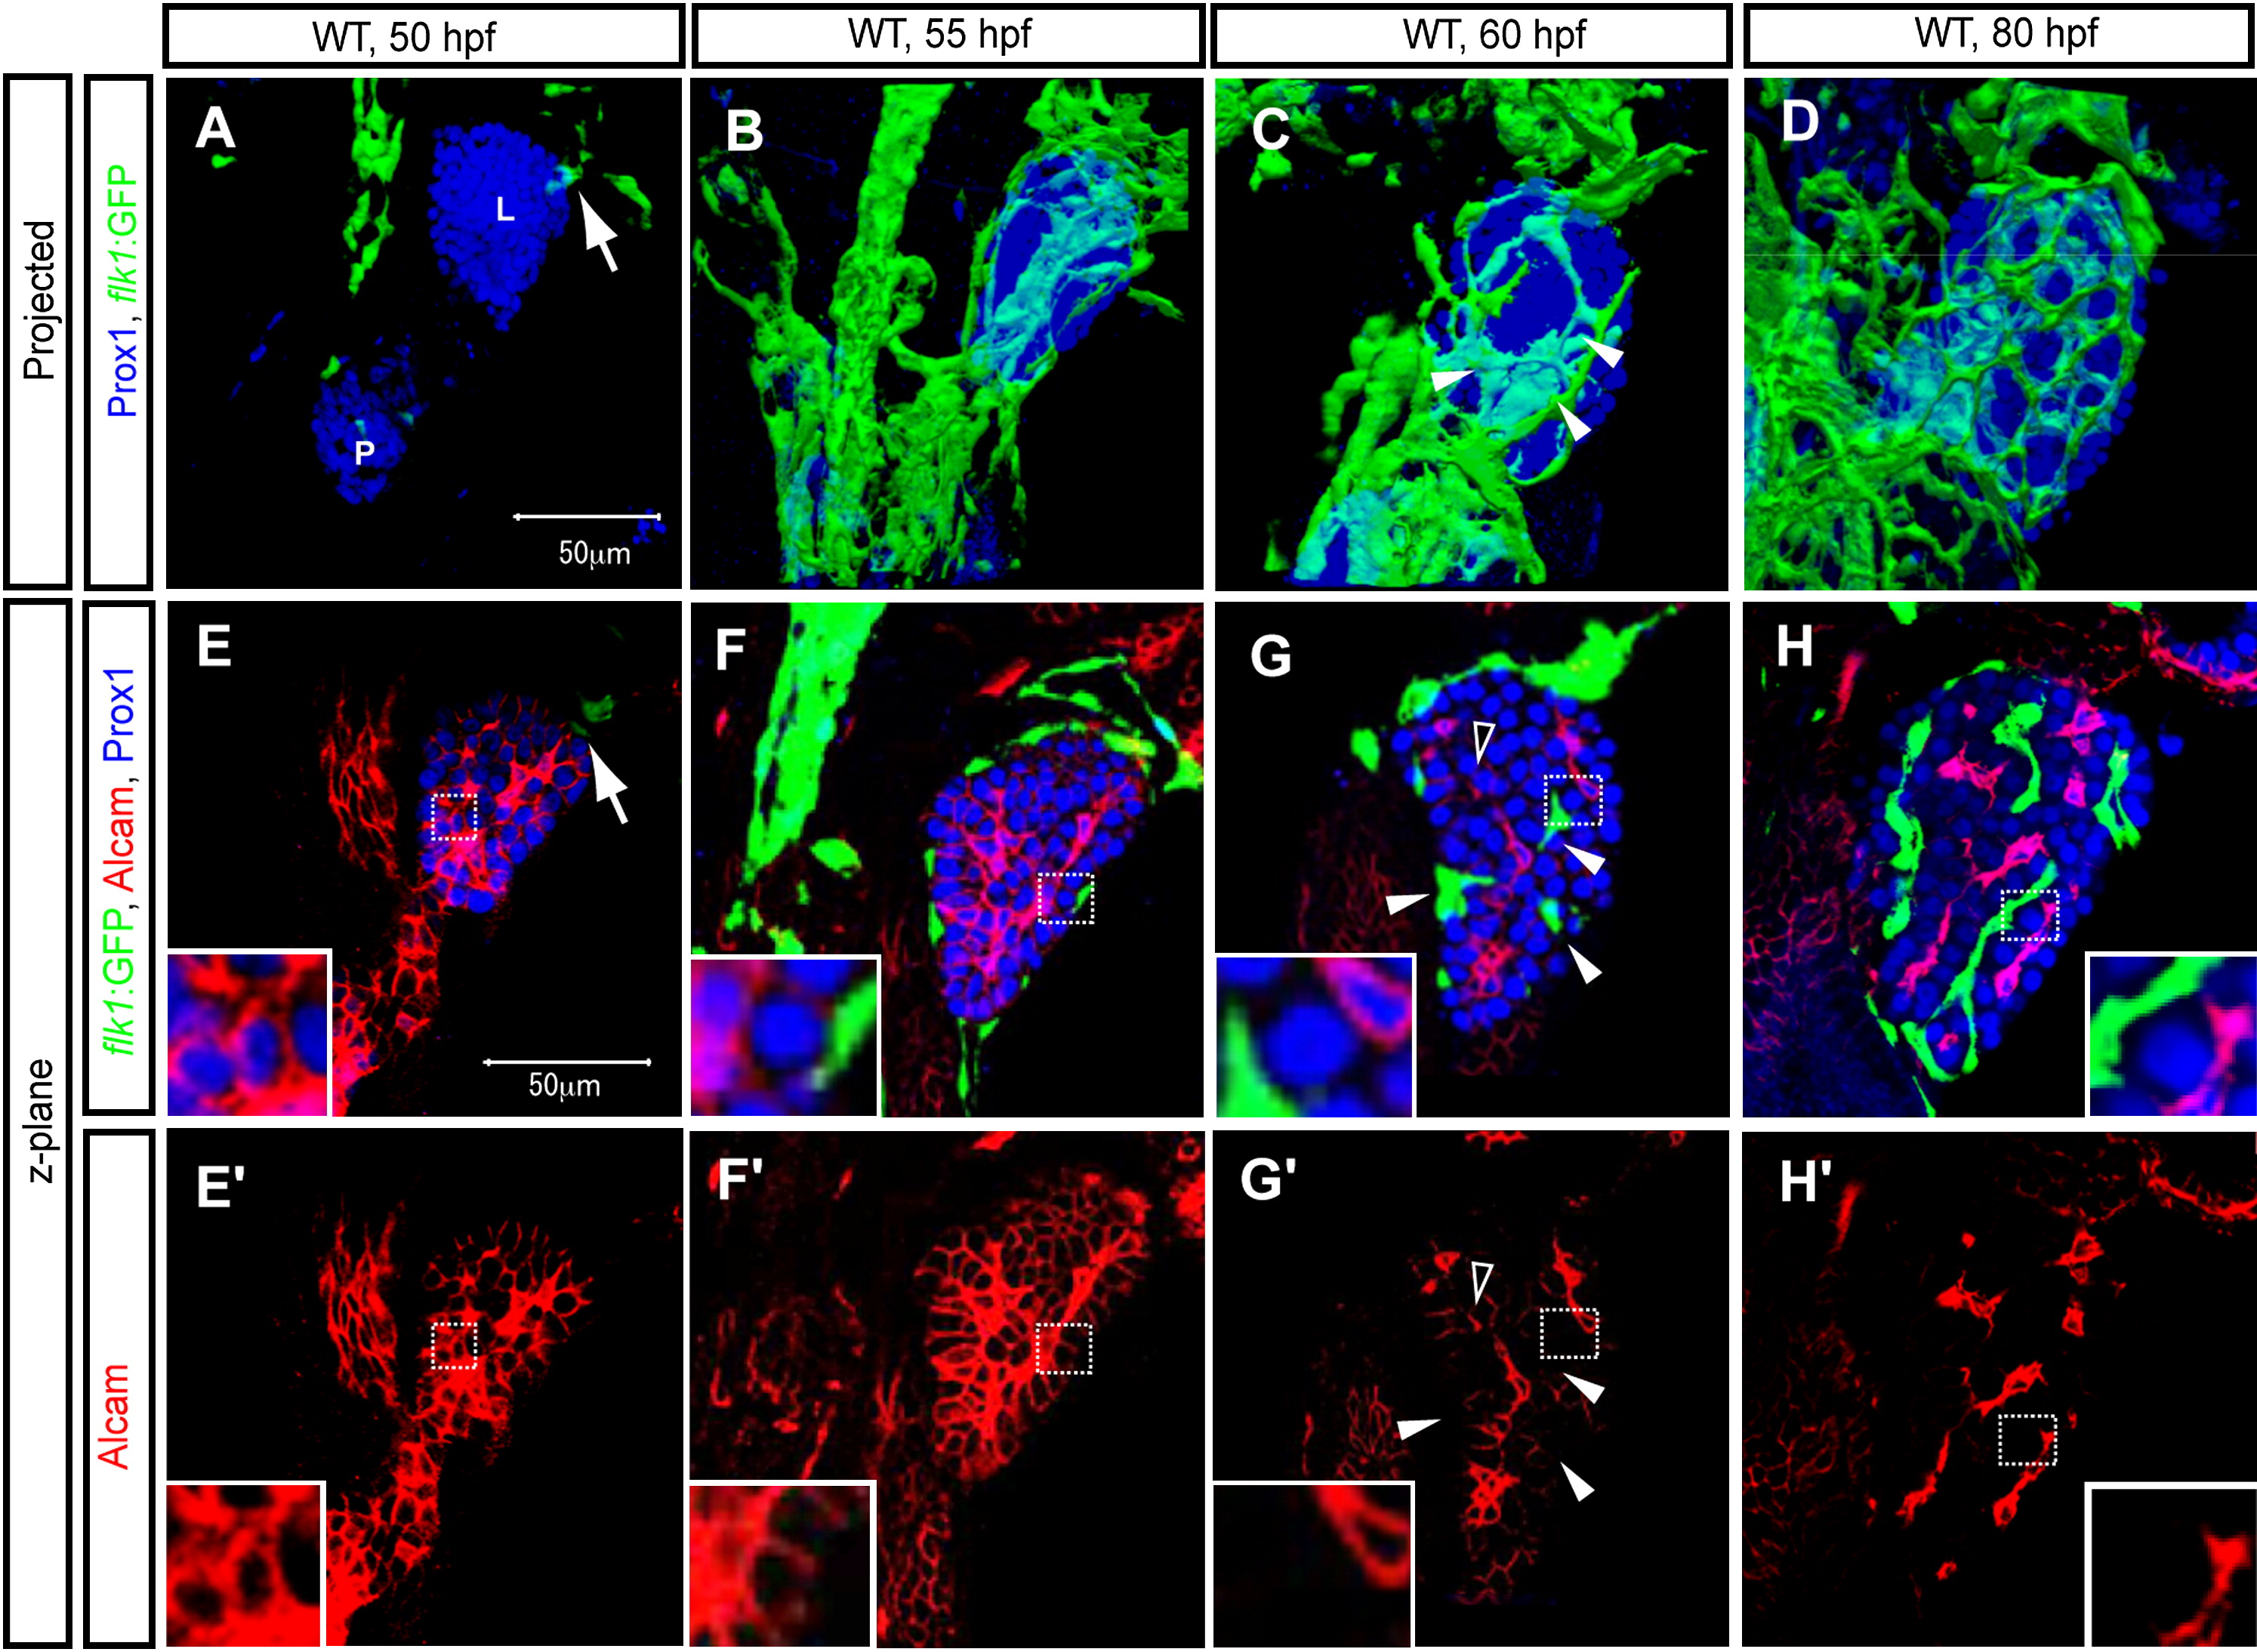
Fig. 2 Coordinated Development of the Intrahepatic Vascular and Biliary Networks
Projected (A–D) and z-plane (E–H) confocal images of the liver at 50 (A and F), 55 (B and G), 60 (C and H), and 80 (D and I) hpf. The images present ventral views, anterior to the top.
(A–D) Tg(flk1:EGFP)s843 larvae visualized for GFP (green) and Prox1 (blue) expression.
(A) By 50 hpf, endothelial cells have established contact with the liver on its dorsolateral side (as indicated by the arrow).
(B) By 55 hpf, endothelial cells have surrounded the liver.
(C) By 60 hpf, endothelial cells have started to invade the liver (as indicated by white arrowheads).
(D) By 80 hpf, the endothelial cells have formed a highly branched network in the liver.
(E–H) Tg(flk1:EGFP)s843 larvae visualized for GFP (green), Prox1 (blue), and Alcam (red). The outlined areas are magnified and shown in bottom corners.
(E′–H′) Alcam immunostainings are shown separately. By 60 hpf, Alcam expression has become restricted to the cell membrane opposite to the one contacted by endothelial cells (as indicated by white arrowheads), whereas it is still localized along the entire cell membrane of cells (as indicated by the black arrowhead) located far from the invading endothelial cells. L, liver; P, pancreas.