
|
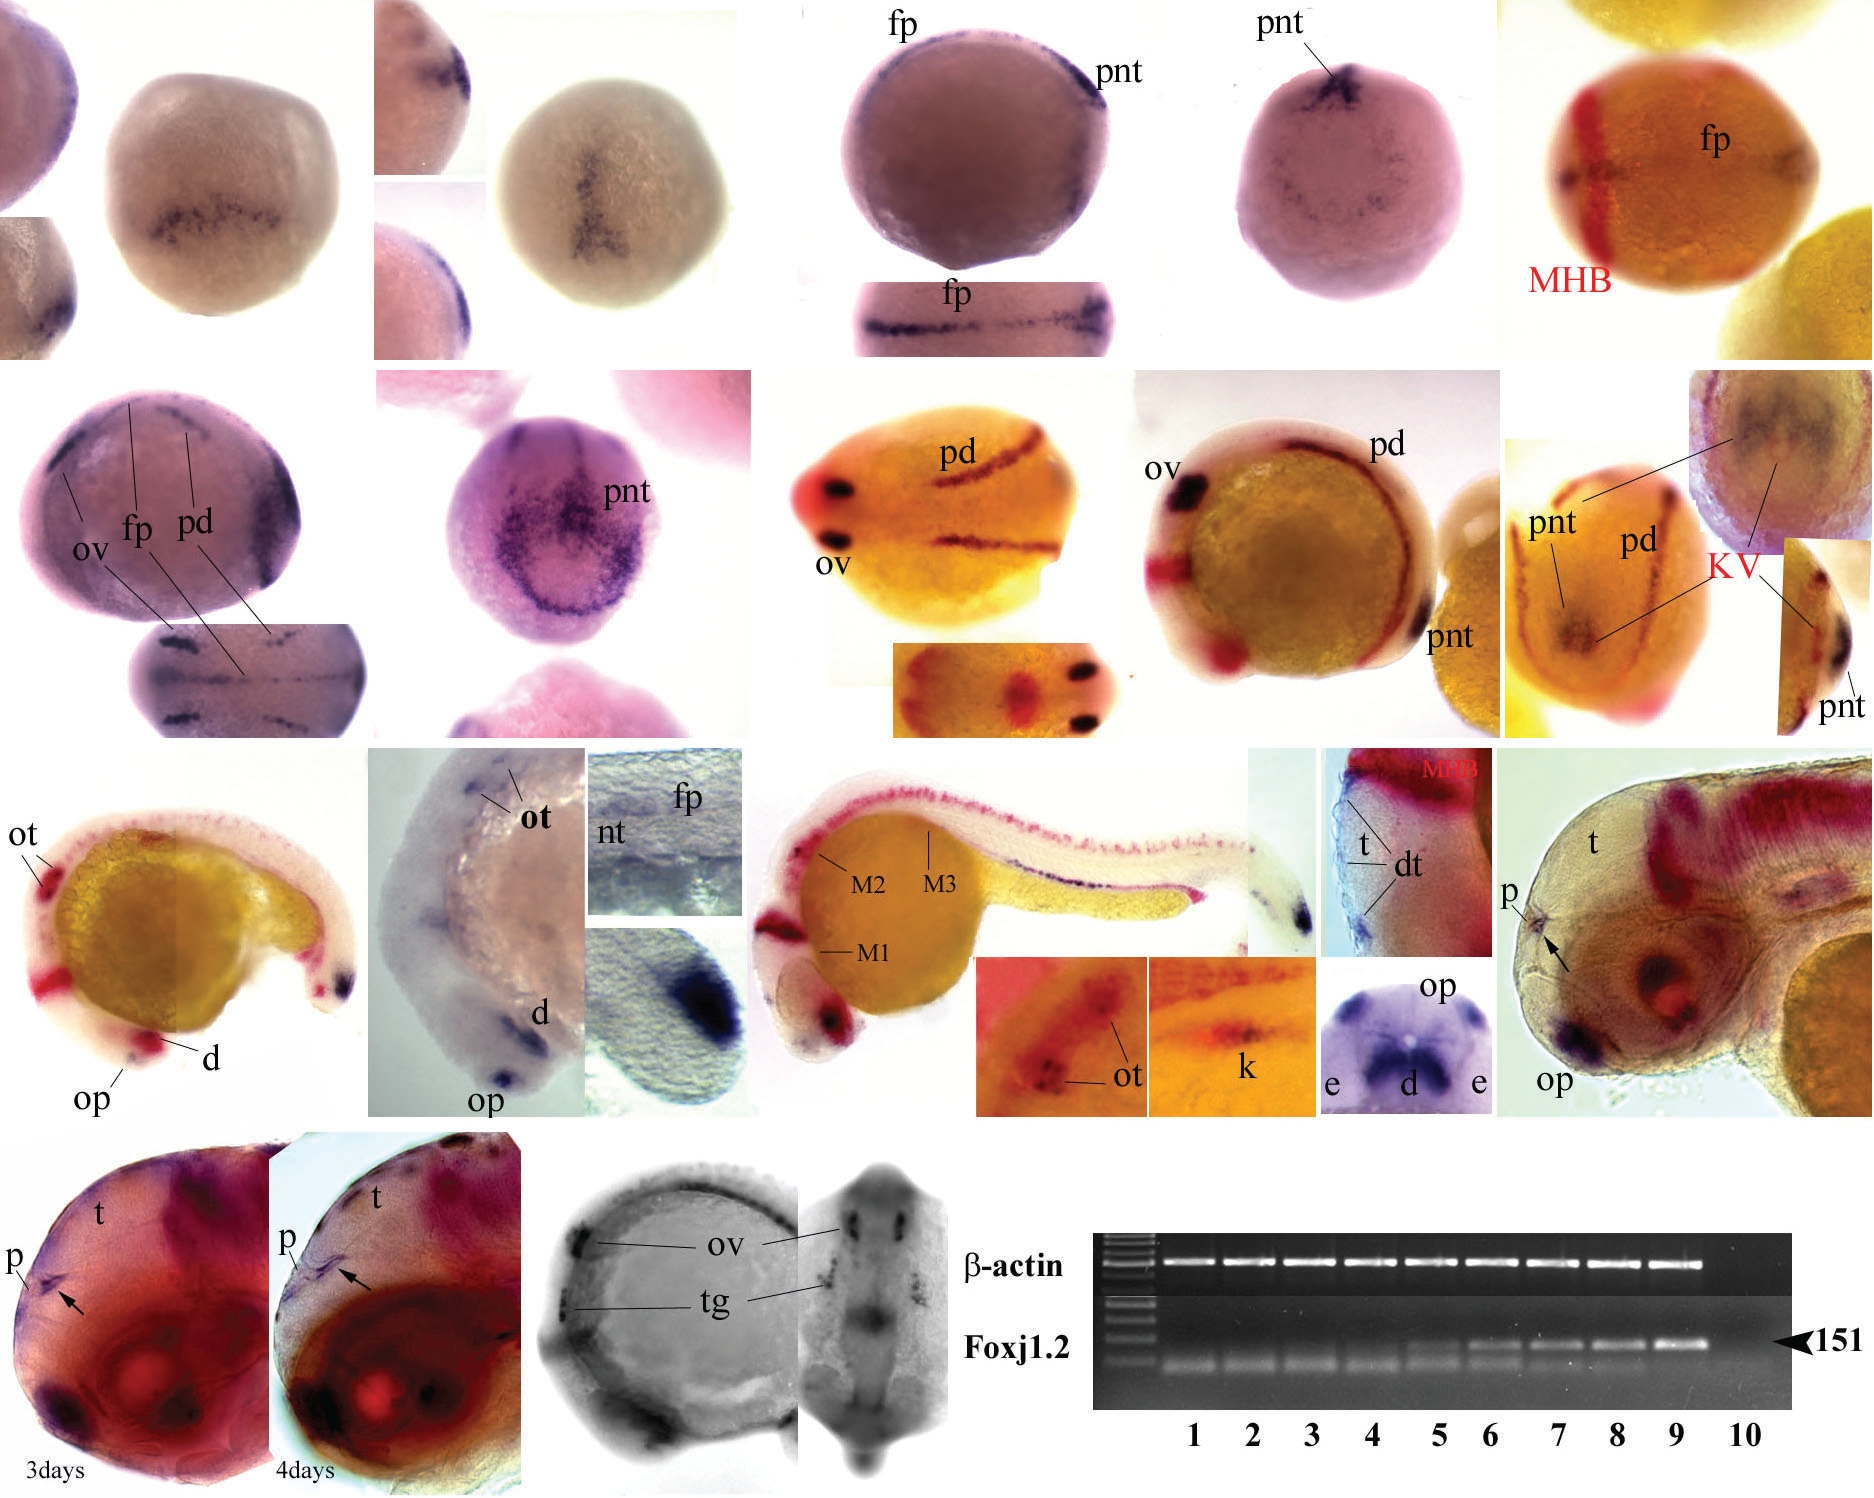
Fig. 4 Zebrafish foxj1.2 expression. (A-P) Spatio-temporal expression pattern of foxj1.2. Whole-mount in situ hybridization with foxj1.2 probe alone (A-D, F-G, L, M4), or combined with pax2.1 and charon (both red) (E, H-K, M-P). Shield-60% epiboly (A), 80% epiboly (B), bud (C-E), 4 somites (FG), 7 somites (H-J), 15 somites (K,P), 16 somites (L), 1 day (M), 2 days (N), 3 and 4 days (P left and right respectively). Views are as follows: dorsal (A, B); dorsal with anterior to the left (C bottom, E, F bottom, H and H bottom), dorsal with anterior up (P right), lateral with dorsal to the right, (A left bottom, B left bottom), lateral with anterior to left (C top, F, I, K-O except for M4, P left), posterior with dorsal up (D, G, J), anterior ventral with dorsal up (M4), animal view (A left top, B left top), ventral with posterior to the right (J right bottom). (Q) RT-PCR expression analysis of foxj1.2 and β-actin as control was performed for different stages (1-8: unfertilized eggs, 100-200 cells, high-dome, 40-50% epiboly, 80-90%, bud, 13-somites, 24hpf and 3days old embryos respectively, and –RT in lane 10). d, diencephalon; dt, dorsal tectum; e, eye; fp, floor plate; k, kidney; KV, Kupffer’s vesicle; MHB, mid-hindbrain boundary; nt, notochord; op, olfactory pit; ot; otolith; ov, otic vesicle; p, pineal gland; pd, pronephric duct; pnt, posterior neural tube; t, tectum; tg, trigeminal ganglion; tv, tectal ventricle.