
IMAGE
Fig. 6
- ID
- ZDB-IMAGE-080701-5
- Genes
- Publication
- Marlow et al., 2004 - No tail co-operates with non-canonical Wnt signaling to regulate posterior body morphogenesis in zebrafish
- All Figures
- Figures for Marlow et al., 2004
Image
|
Figure Caption
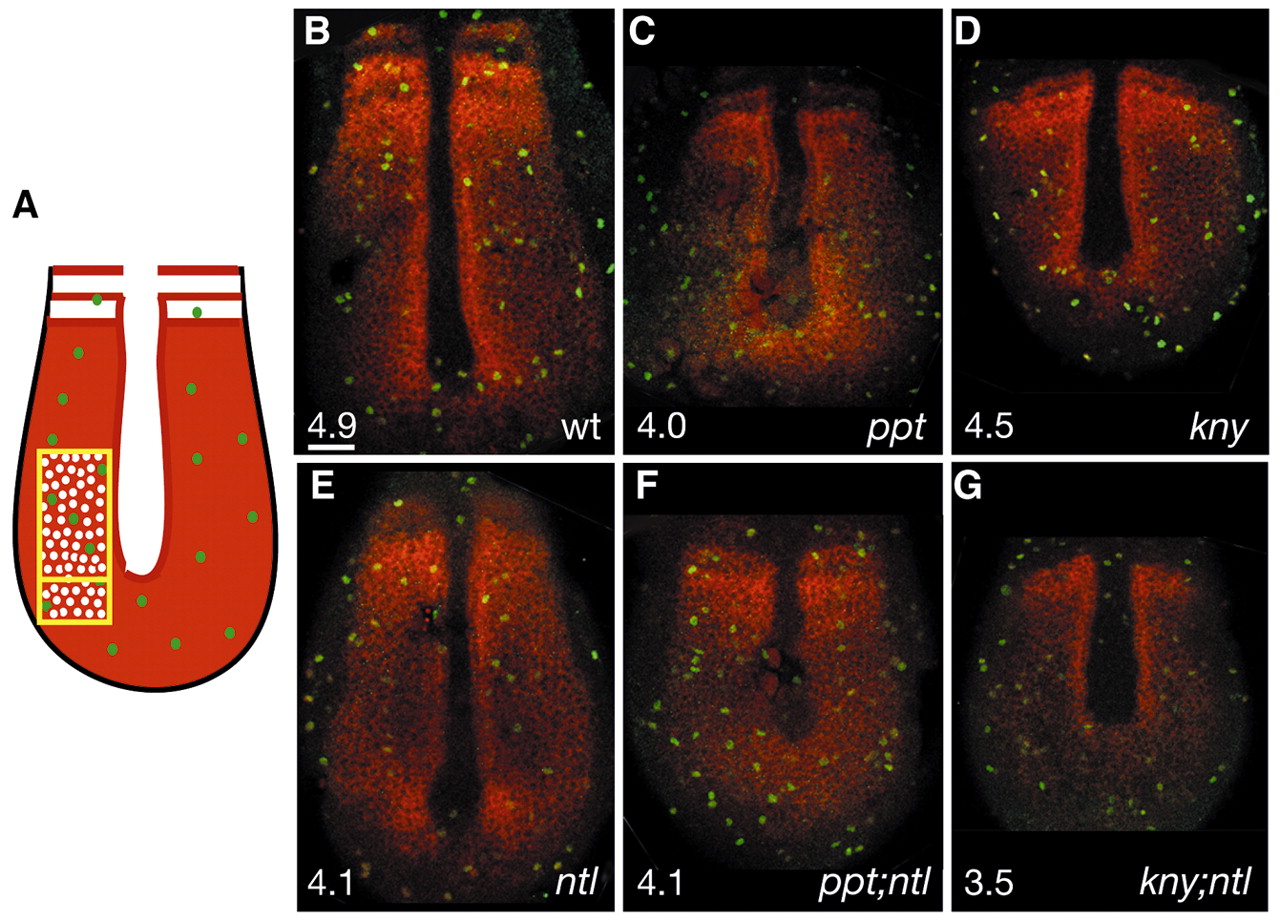
Fig. 6 Abnormal cell proliferation cannot account for the tail elongation defects in double mutants. Schematic representation of the dorsal medial paraxial region, where the ratio of phosphorylated-histone-positive cells (green) to papc-expressing cells (red) was determined (A). Confocal images of dorsal posterior section of the wild type (B), ppt (C), kny (D) and ntl (E) mutants, and ppt;ntl (F) and kny;ntl (G) double mutants at five somites, phosphorylated-histone-positive cells (green) and papc-expressing cells (red). (B-G) Scale bar=50 μm.
Figure Data
Acknowledgments
This image is the copyrighted work of the attributed author or publisher, and
ZFIN has permission only to display this image to its users.
Additional permissions should be obtained from the applicable author or publisher of the image.
Full text @ Development