
Image
|
Figure Caption
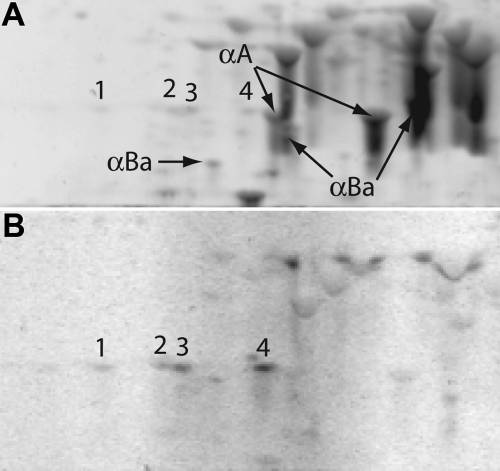
Fig. 3 Phosphoprotein staining of two-dimensional electrophoresis gels (pH 5–8) indicates phosphorylated αA-crystallins. Numbers identify the equivalent αA-crystallin spots on gels stained with the total protein stain (A) and the phosphoprotein-specific stain (B). Labels and arrows indicate α-crystallin spots that were not detected by the phosphoprotein stain.
Figure Data
Acknowledgments
This image is the copyrighted work of the attributed author or publisher, and
ZFIN has permission only to display this image to its users.
Additional permissions should be obtained from the applicable author or publisher of the image.