
IMAGE
Fig. TS1
- ID
- ZDB-IMAGE-080416-2
- Genes
- Publication
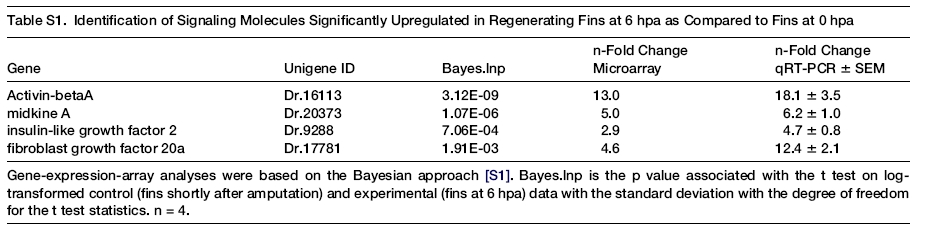
- Jazwinska et al., 2007 - Activin-betaA Signaling Is Required for Zebrafish Fin Regeneration
- All Figures
- Figures for Jazwinska et al., 2007
Image
|
Figure Caption
Fig. TS1 Gene-expression-array analyses were based on the Bayesian approach [S1]. Bayes.lnp is the p value associated with the t test on log-transformed control (fins shortly after amputation) and experimental (fins at 6 hpa) data with the standard deviation with the degree of freedom for the t test statistics. n = 4.
Figure Data
Acknowledgments
This image is the copyrighted work of the attributed author or publisher, and
ZFIN has permission only to display this image to its users.
Additional permissions should be obtained from the applicable author or publisher of the image.
Full text @ Curr. Biol.