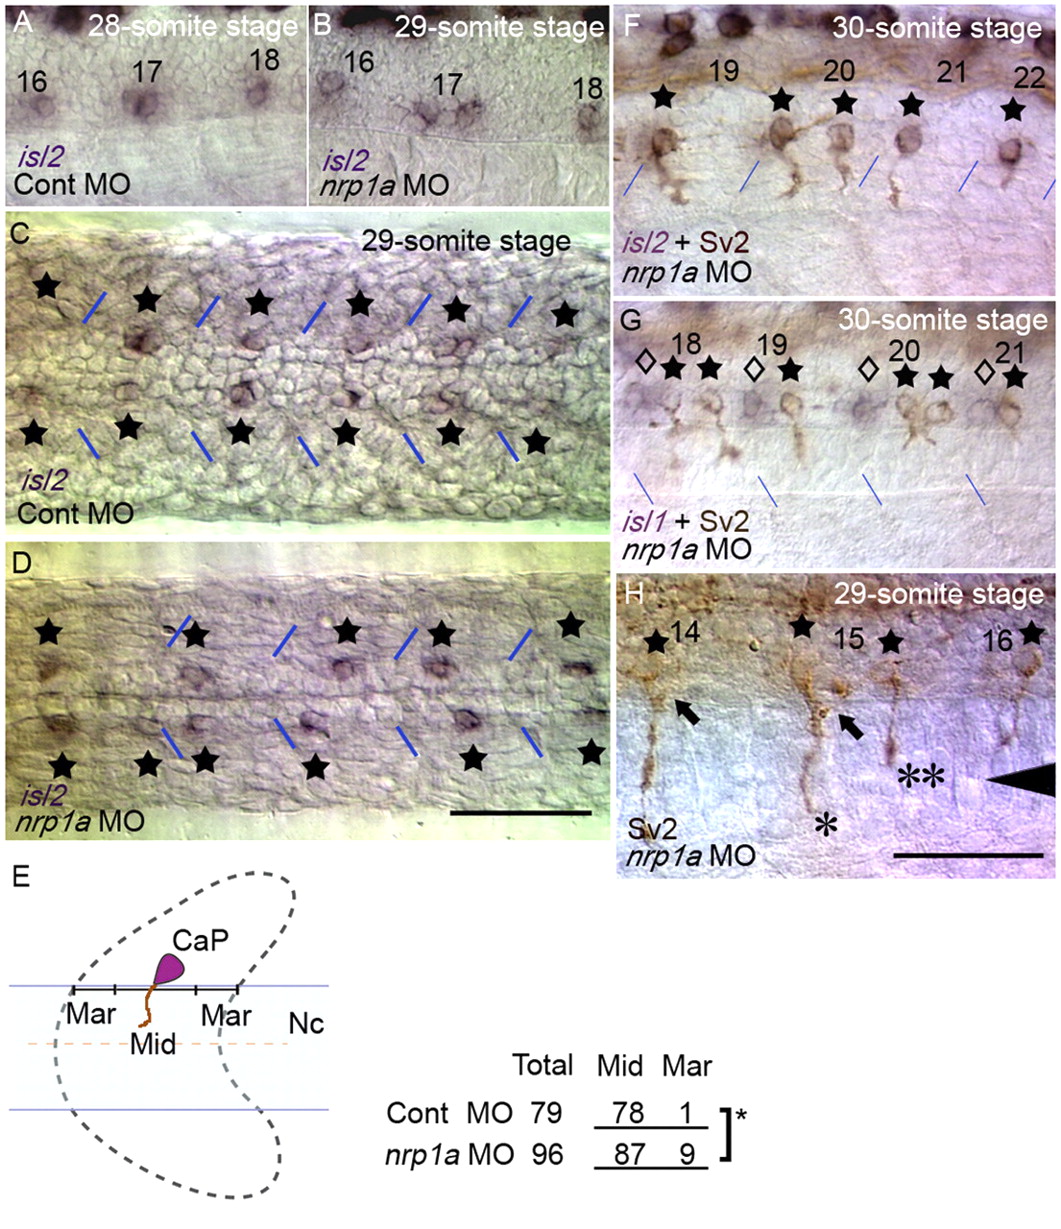
Fig. 3 Knockdown of Nrp1a results in abnormal CaP cell positioning even after axon formation. Position of CaP cell bodies after axonogenesis was examined using isl2 expression (purple) and mAb Sv2 (brown). (A) Side view of a control embryo at the 28-somite stage. (B) A Nrp1a-knockdown embryo at the 29-somite stage with an irregular CaP pattern. (C,D) Horizontal sections of control and Nrp1a-knockdown embryos. CaPs are indicated by stars. (E; left) Severe dislocation was defined as the center of the CaP cell bodies being located in either the anterior or the posterior quarter of the overlying somite (indicated by `Mar' in the schema). (Right) Dislocation of CaP was significantly increased in Nrp1a-knockdown embryos, as determined by Fisher's exact test of independence (star, P<0.05).Nc, notochord. (F) Abnormal exit points of CaP axons by two separate CaPs in Nrp1a-knockdown embryos. CaP axons were labeled with mAb Sv2. (G) The positions of CaPs (stars) relative to MiP and RoP (diamonds, labeled by isl1) were unaffected by Nrp1a knockdown. (H) Different lengths of two axons from separate CaPs correspond to those of a CaP and a VaP. One axon extended onto the ventral myotome (*), whereas the other axon did not extend beyond the horizontal myoseptum (**). Arrowhead shows the level of the horizontal myoseptum. MiP axons extended normally along the dorsal pathway (arrows). The numbers in A, B and F-H denote the somitic segment order. The blue lines indicate segment borders. Scale bar: 50 μm.
Image
Figure Caption
Figure Data
Acknowledgments
This image is the copyrighted work of the attributed author or publisher, and
ZFIN has permission only to display this image to its users.
Additional permissions should be obtained from the applicable author or publisher of the image.
Full text @ Development

