
Fig. S1
- ID
- ZDB-IMAGE-080114-17
- Genes
- Publication
- Matthews et al., 2008 - Transcription factor onecut3 regulates intrahepatic biliary development in zebrafish
- All Figures
- Figures for Matthews et al., 2008
|
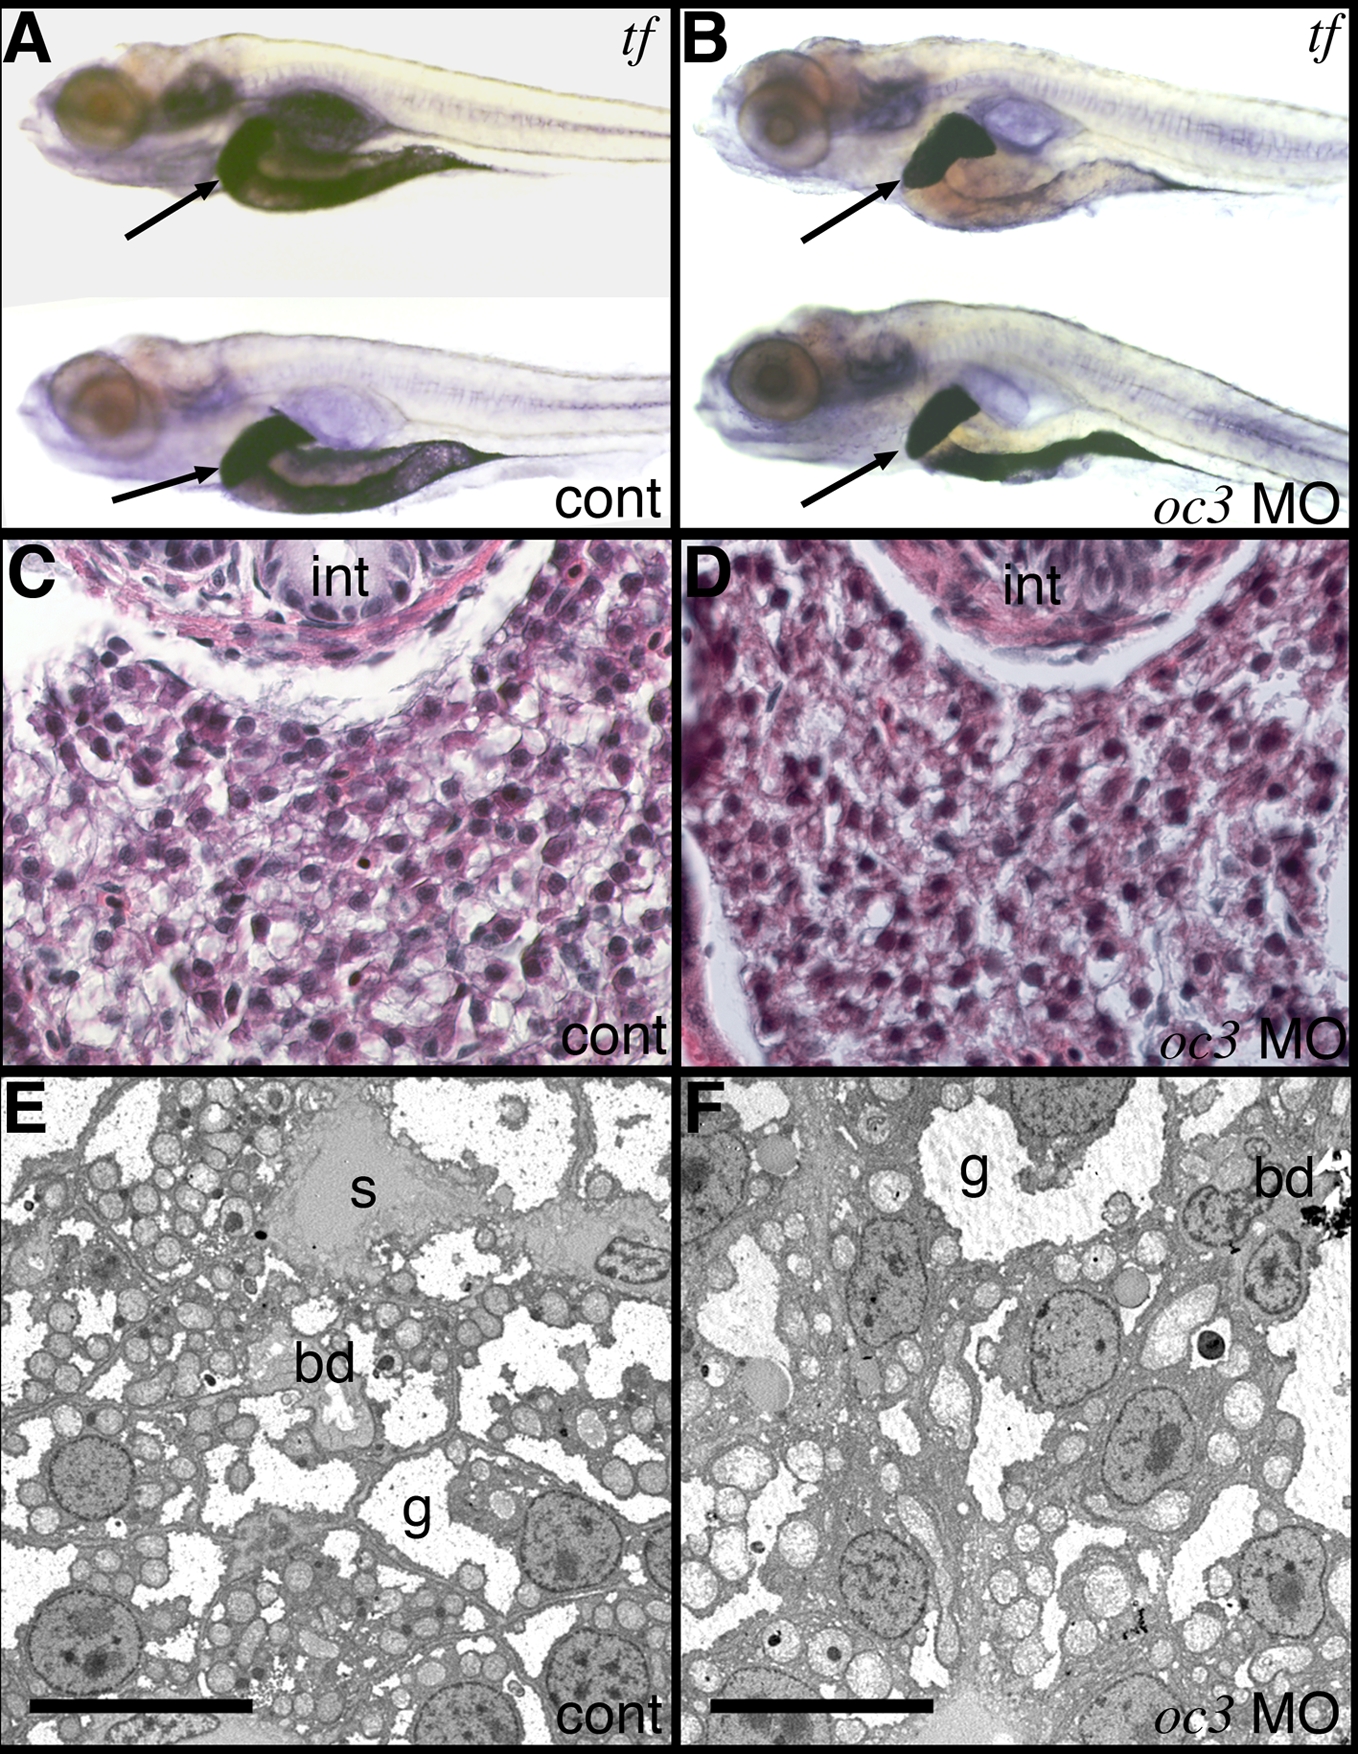
Fig. S1 Comparison of liver size and morphology of Oc3 morpholino-injected larvae. (A-B) Left lateral views of in situ hybridizations of 5 dpf control (A) and Oc3 morpholino-injected (B) larvae using transferrin (tf) as riboprobe. Similar results were obtained using a ceruloplasmin riboprobe (not shown). Livers are denoted by black arrows. Note the similarity of size between controls and morpholino-injected larvae. (C-D). Cross-sections of 5 dpf liver from (C) control and (D) Oc3 morpholino-injected larvae stained with hematoxylin and eosin. Tissues were fixed in paraformaldehyde, embedded in paraffin, and stained in accordance with standard techniques. Note the similarity in appearance. (E-F) Electron micrographs of control (E) and Oc3 morpholino-injected 5 dpf larvae (F). Note the overall similarity in appearance of hepatocytes, which represent almost the entirety of the depicted fields. Other structures identified include glycogen (g), liver sinusoid (s), and bile duct (bd). Scale bars denote 10 μm.