
Fig. 5
- ID
- ZDB-IMAGE-071019-45
- Genes
- Publication
- Warga et al., 2007 - A role for N-cadherin in mesodermal morphogenesis during gastrulation
- All Figures
- Figures for Warga et al., 2007
|
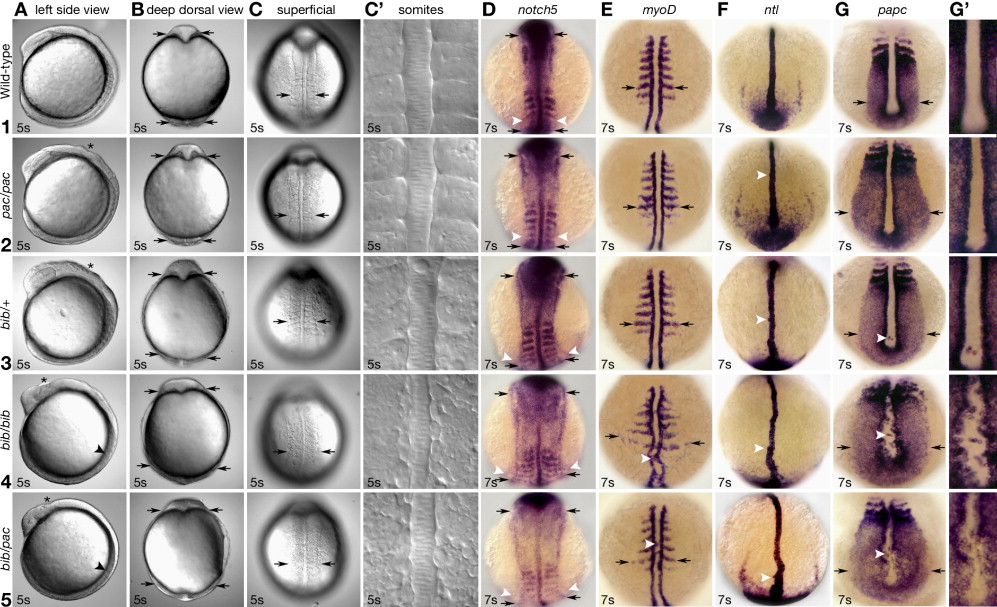
Fig. 5 Comparison of the bib and pac phenotypes. Rows (1–5) indicate genotype of the individual. In the case of all bib and wild-type individuals, all which are siblings, this was determined by linkage mapping, with the exception of ntl and notch5 expression, where the genotype was inferred by phenotype. Also, for the pac homozygotes and bib/pac transheterozygotes, genotype was based on phenotype. Columns (A–C) show the same live embryo from a different view. Columns (D–G) show whole-mount in situ hybridizations. (A) Asterisk indicates uneven neural keel; arrowhead indicates absence of somite furrows. (B) Optical cross section at level of midbrain–hindbrain, arrows indicate width of neural plate. (C) Superficial view of somite region, arrows indicate width of paraxial mesoderm at level of 4th somite. (C2) Magnified view showing epithelial organization. (D) Dorsal view, arrows indicate width of neural plate; arrowheads indicate width of paraxial mesoderm. (E) Dorsal view, arrows indicate width of paraxial mesoderm, arrowhead indicates cells in notochord domain. (F) Dorsal view, arrowhead indicates knobby notochord protrusions. (G) Vegetal view, arrows indicate width of tailbud, arrowhead indicates cells in notochord domain. (G′) Magnified view showing irregular paraxial–notochord border and ectopic cells.
Reprinted from Developmental Biology, 310(2), Warga, R.M., and Kane, D.A., A role for N-cadherin in mesodermal morphogenesis during gastrulation, 211-225, Copyright (2007) with permission from Elsevier. Full text @ Dev. Biol.