
Fig. 2
- ID
- ZDB-IMAGE-071004-100
- Genes
- Publication
- Loeb-Hennard et al., 2005 - Prominent transcription of zebrafish N-myc (nmyc1) in tectal and retinal growth zones during embryonic and early larval development
- All Figures
- Figures for Loeb-Hennard et al., 2005
|
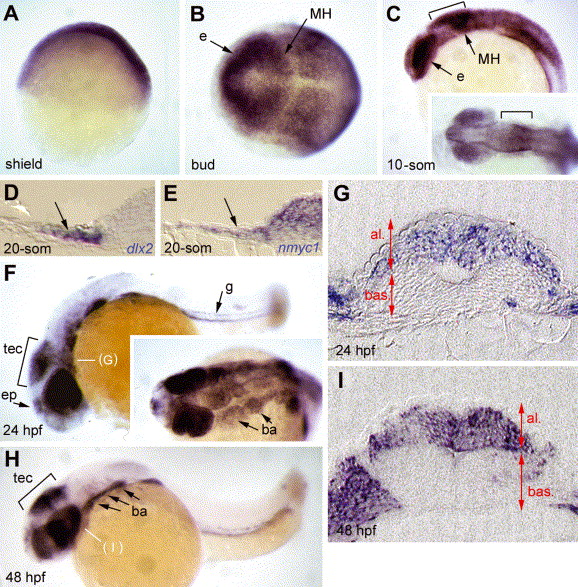
Fig. 2 Expression of zebrafish nmyc1 highlights restricted neural and endodermal domains at embryonic stages. Expression of nmyc1 revealed by in situ hybridization with a digoxygenin-labelled nmyc1 antisense riboprobe on whole-mount embryos (anterior left; lateral views in A,C,F,H; dorsal views in B, C inset, F inset; stages indicated bottom left of each panel). (D) and (E) are cross-sections at the 20-somite stage at the midbrain level to compare dlx2 and nmyc1 expression in neural crest cells (one half of the embryos only is shown). (G) and (I) are sections of the embryos shown in (F) and (H), respectively, at the levels indicated. Expression at early stages is ubiquitous but progressively resolves into restricted positive domains in endodermal derivatives (g), migrating neural crest cells (arrows in D, E), branchial arches (ba) and limited brain territories. The latter include the epiphysis (ep), the eye (e) and the midbrain-hindbrain (MH, bracket in C,F,H). MH expression is restricted to the alar plate (al) and absent from the basal plate (bas) (see G,I), thus labels the presumptive optic tectum (tec) and dorsal anterior hindbrain.
Reprinted from Gene expression patterns : GEP, 5(3), Loeb-Hennard, C., Kremmer, E., and Bally-Cuif, L., Prominent transcription of zebrafish N-myc (nmyc1) in tectal and retinal growth zones during embryonic and early larval development, 341-347, Copyright (2005) with permission from Elsevier. Full text @ Gene Expr. Patterns