
|
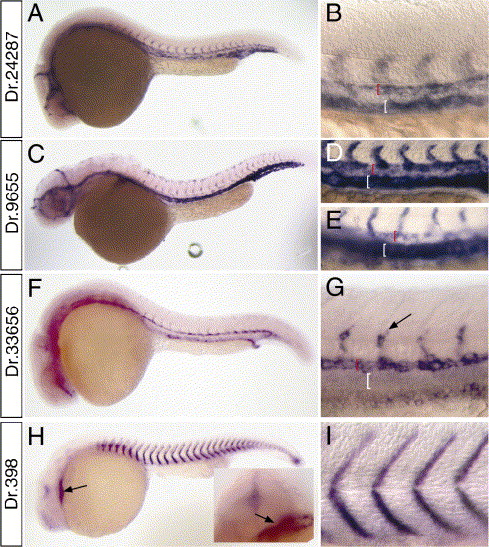
Fig. 4 Whole mount in situ hybridization analysis of cardiovascular markers. (A, B) Dr.24287 at 24 hpf; box indicates magnified view in panel B. (B) Black bracket indicates dorsal aorta, white bracket shows posterior cardinal vein. (C-E) Dr.9655. (C) Embryo at 30 hpf. (D) Magnified view of dorsal aorta (red bracket) and posterior cardinal vein (white bracket) at 24 hpf; (E) dorsal aorta (red bracket) and posterior cardinal vein (white bracket) at 30 hpf. (F, G) Dr.33656. (G) Expression in segmental arteries (black arrow) and dorsal aorta (red bracket); expression is absent from posterior cardinal vein (white bracket). (H, I) Dr.398 at 24 hpf. (H) Arrow indicated expression in heart; inset head-on view showing heart expression (arrow). (I) Magnified view of embryo in panel H.
Reprinted from Developmental Biology, 299(2), Covassin, L., Amigo, J.D., Suzuki, K., Teplyuk, V., Straubhaar, J., and Lawson, N.D., Global analysis of hematopoietic and vascular endothelial gene expression by tissue specific microarray profiling in zebrafish, 551-562, Copyright (2006) with permission from Elsevier. Full text @ Dev. Biol.