
Fig. 3
- ID
- ZDB-IMAGE-071001-120
- Genes
- Publication
- Zecchin et al., 2007 - Distinct delta and jagged genes control sequential segregation of pancreatic cell types from precursor pools in zebrafish
- All Figures
- Figures for Zecchin et al., 2007
|
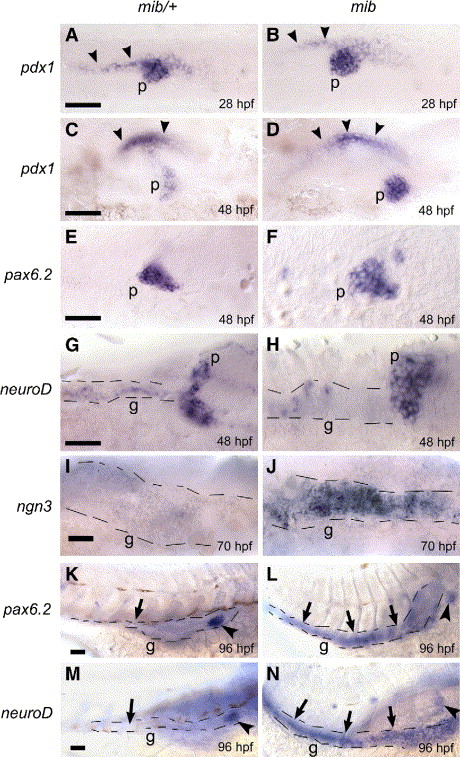
Fig. 3 Endoderm development in mib mutants. In situ hybridizations showing expression of pdx1, pax6.2, neuroD and ngn3 in the endoderm of mib mutant embryos and controls. Panels A–D: pdx1 is expressed at normal levels in the gut (arrowheads) of mib embryos and their wild type siblings, whereas its expression is stronger in the endocrine pancreas (p) of mib mutants (B, D) when compared with controls (A, C). Panels E–H: the expression of neuroD and pax6.2, both active in endocrine precursors, is stronger in the endocrine pancreas (p) of mib mutants (F, H) when compared with controls (E, G). The gut (g) is outlined. Panels I–J: ngn3 is expressed ectopically in the gut (g, also outlined) of mib mutants. Panels K–N: neuroD and pax6.2 are expressed ectopically in the gut (g, indicated by arrows and outlined) of mib mutants (L, N). The endocrine pancreas (arrowhead) is indicated. Embryos are presented in ventral (A–J) or lateral (K–N) views with anterior to the left (A–J) or to the right (K–N). Scale bar is 50 μm.
Reprinted from Developmental Biology, 301(1), Zecchin, E., Filippi, A., Biemar, F., Tiso, N., Pauls, S., Ellertsdottir, E., Gnugge, L., Bortolussi, M., Driever, W., and Argenton, F., Distinct delta and jagged genes control sequential segregation of pancreatic cell types from precursor pools in zebrafish, 192-204, Copyright (2007) with permission from Elsevier. Full text @ Dev. Biol.