
|
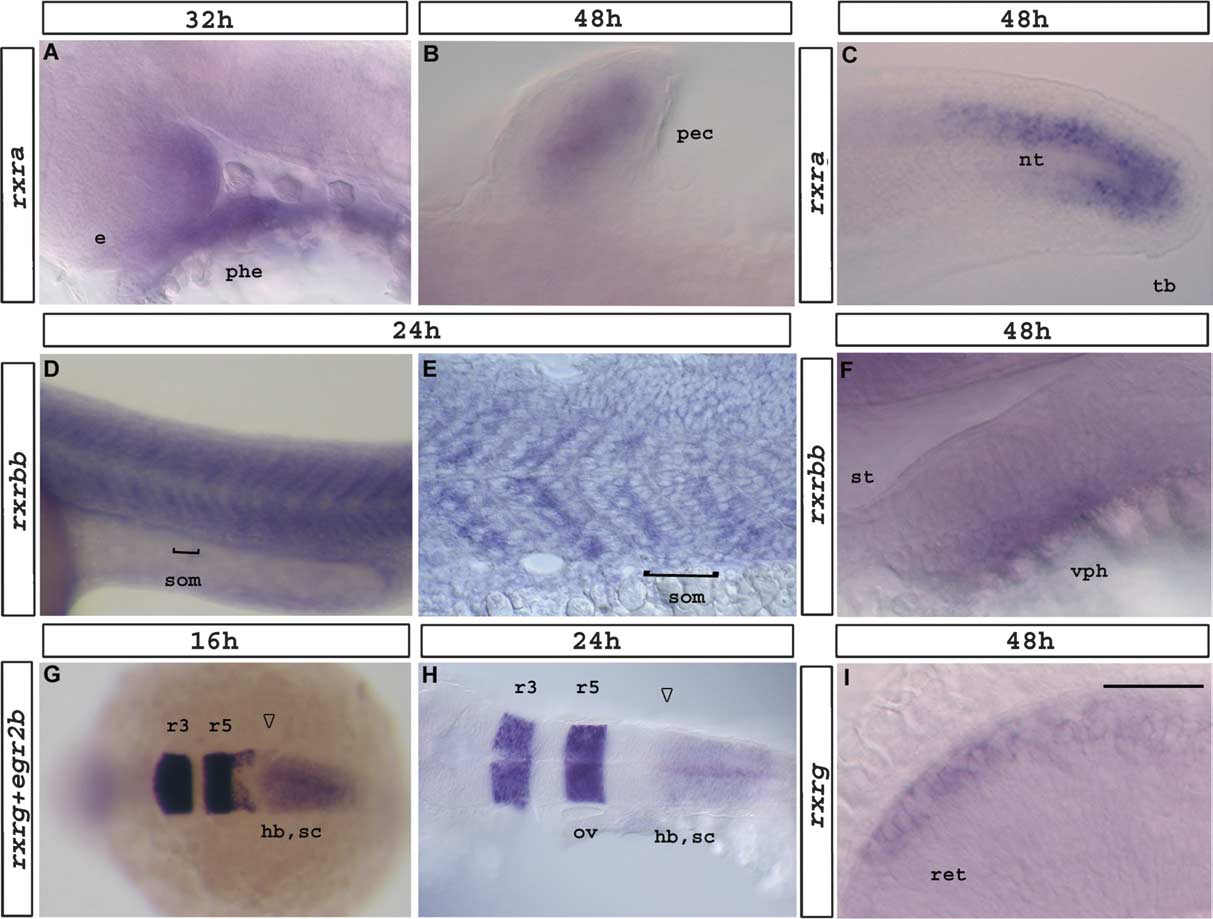
Fig. 5 Expression of rxra (A–C), rxrbb (F,G,H) and rxrg (D,E,I). Refer to text for detailed descriptions. Flat-mount embryos seen from a dorsal view (B,G,H) or a lateral view (A,C–F,I). Anterior is to the left. (A) Magnified view of rxra expression in the anterior endoderm and the eye at 32 hpf. (B) rxra pectoral fin bud expression at 48 hpf. (C) rxra tail expression at 48 hpf. (D,E) Stripes of rxrbb expression at 24 hpf in somites. Higher magnification view of somites. Bar in (D,E) marks the boundary from one somite to the next. (E) Sagittal section. (F) rxrbb expression in the ventral head tissue at 48 hpf. (G,H) Dorsal view of a whole-mount embryo. rxrg and egr2b expression at 16 hpf (G) and 24 hpf (H). Arrow in (G,H) marks anterior border of rxrg expression. (I) Magnified view of rxrg expression in the eye at 48 hpf. Abbreviations: e, eye; ov, otic vesicle; pec, pectoral fin bud; hb, hindbrain; nt, notochord; r3, rhombomere 3; r5, rhombomere 5; ret, retina; sc, spinal cord; st, stomadeum; tb, tailbud; vph, ventral tissue in pharyngeal region. Scale bar represents 60 μm in 5A; 27 μm in 5B; 63 μm in 5C; 135 μm in 5D; 48 μm in 5E; 23 μm in 5F; 159 μm in 5G; 119 μm in 5H; 19 μm in 5I.
Reprinted from Gene expression patterns : GEP, 6(5), Tallafuss, A., Hale, L.A., Yan, Y.L., Dudley, L., Eisen, J.S., and Postlethwait, J.H., Characterization of retinoid-X receptor genes rxra, rxrba, rxrbb and rxrg during zebrafish development, 556-565, Copyright (2006) with permission from Elsevier. Full text @ Gene Expr. Patterns