
|
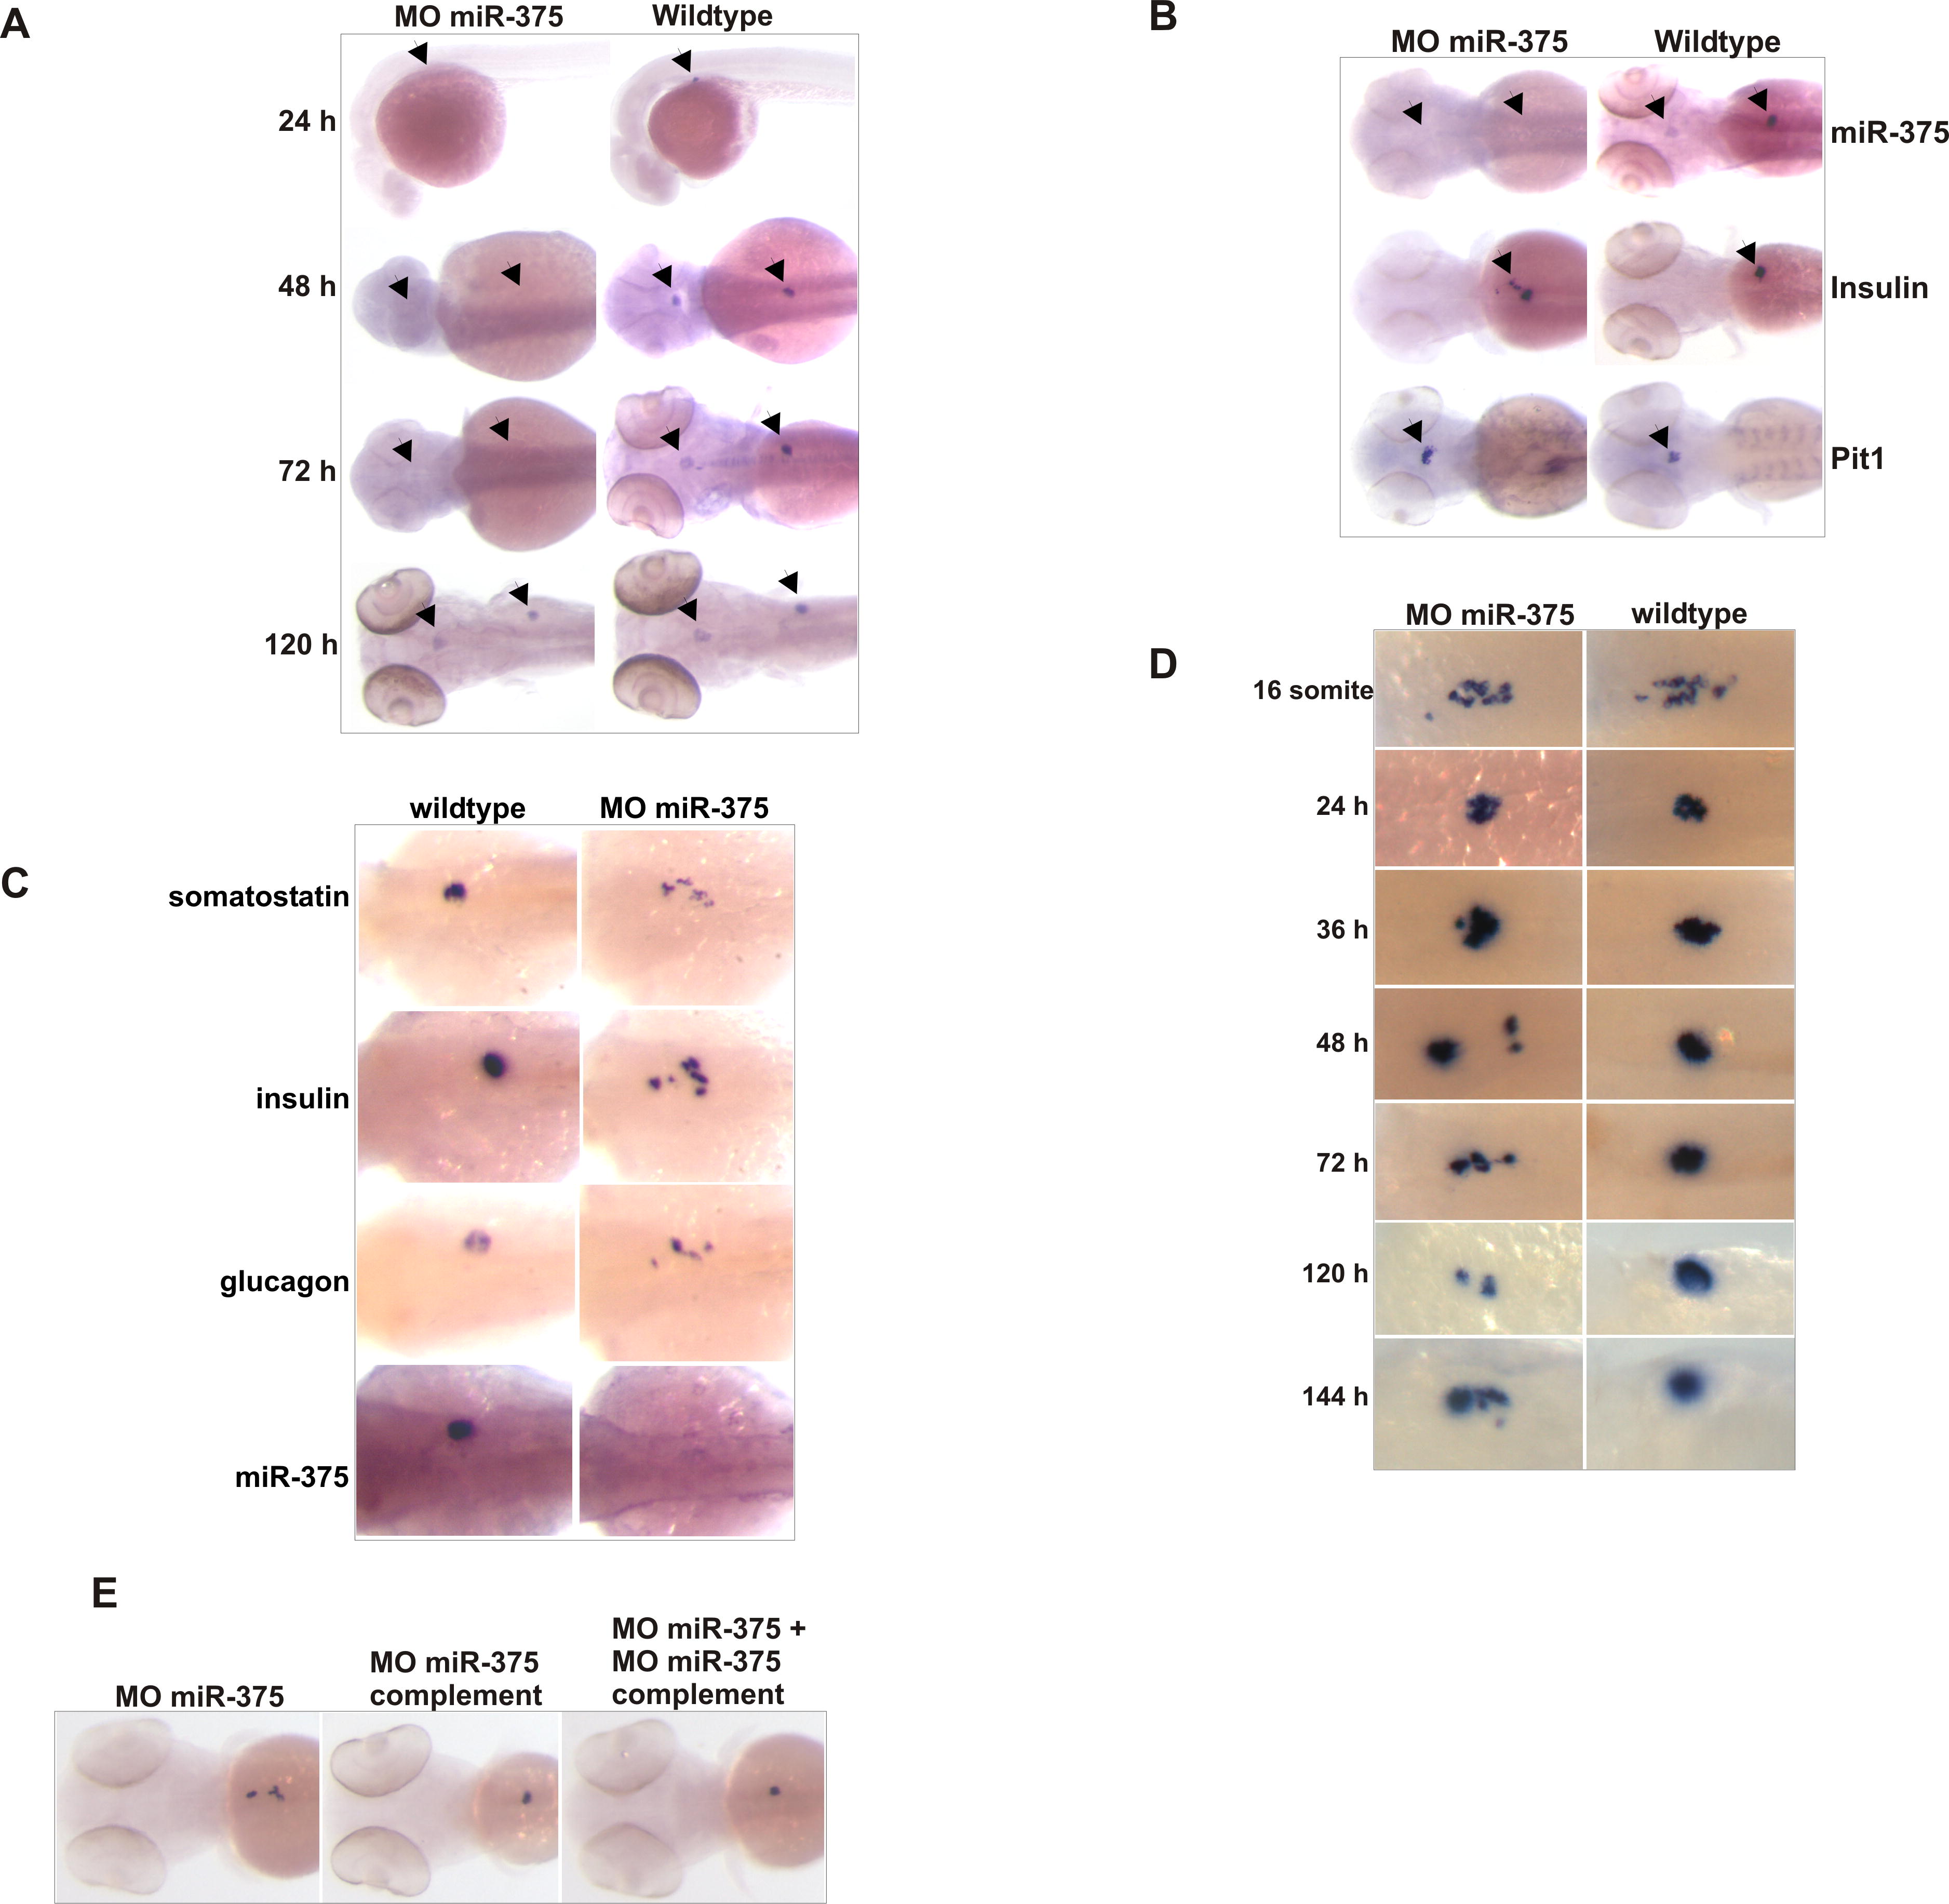
Fig. 5 Knockdown of miR-375 Results in Aberrant Migration of Pancreatic Islet Cells (A) In situ analysis of miR-375 knockdown in MO miR-375–injected embryos and noninjected controls at 24, 48, 72, and 120 hpf. Arrowheads indicate the pituitary gland and the pancreatic islet. (B) In situ analysis of the pancreatic islet (insulin staining) and the pituitary gland (pit1 staining) in miR-375 morphants and noninjected controls. Arrowheads indicate the pituitary gland and the pancreatic islet. (C) In situ analysis of pancreatic islet development in wild-type and morphant embryos using insulin, somatostatin, and glucagon as markers. (D) Time series of insulin expression in wild-type and morphant embryos injected with MO miR-375. (E) Insulin expression in 72-hpf embryos injected with MO miR-375 and a complementary morpholino.