
Fig. 6
|
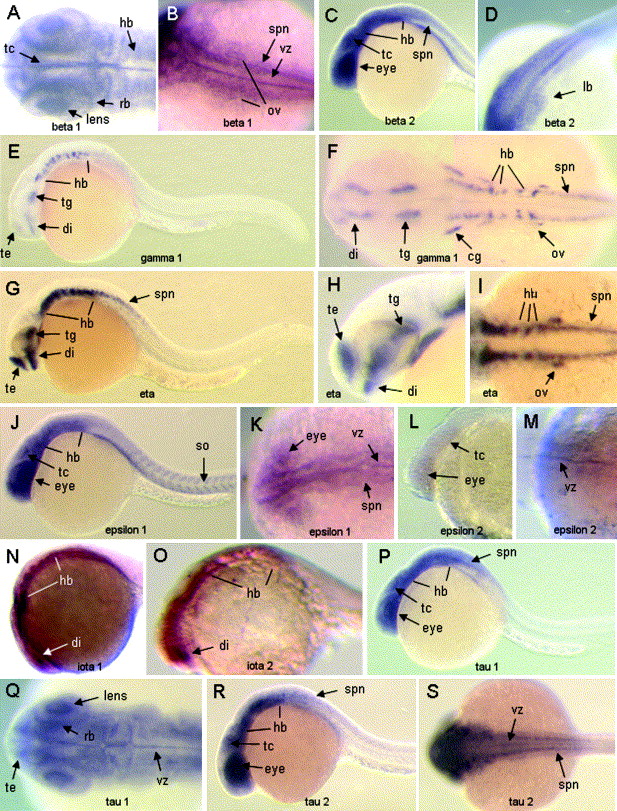
Fig. 6 Expression of 14-3-3 family members in 24 h stage embryos. All views are lateral, except when noted. (A) Beta 1, dorsal view; (B) beta 1, dorsal view; (C) beta 2; (D) enlargement of beta 2; (E) gamma 1; (F) gamma 1, dorsal view; (G) eta; (H) enlargement of eta; (I) dorsal view of eta; (J) epsilon 1; (K) epsilon 1, dorsal view; (L) epsilon 2, (M) epsilon 2, dorsal view; (N) iota 1; (O) iota 2; (P) tau 1; (Q) tau 1, dorsal view; (R) tau 2; and (S) tau 2, dorsal view. di, diencephalon; cg, cranial ganglia; he, heart; hb, hindbrain; lb, liver bud; ov, otic vesicle; rb, outer retina boundary; spn, spinal chord neurons; so, somites; tc, tectum; te, telencephalon; tg, tegmentum in the midbrain; vz, ventricular zone.
Reprinted from Gene expression patterns : GEP, 7(4), Besser, J., Bagowski, C.P., Salas-Vidal, E., van Hemert, M.J., Bussmann, J., and Spaink, H.P., Expression analysis of the family of 14-3-3 proteins in zebrafish development, 511-520, Copyright (2007) with permission from Elsevier. Full text @ Gene Expr. Patterns