
Fig. 1
- ID
- ZDB-IMAGE-070613-94
- Genes
- Publication
- Ward et al., 2007 - Origin of the zebrafish endocrine and exocrine pancreas
- All Figures
- Figures for Ward et al., 2007
|
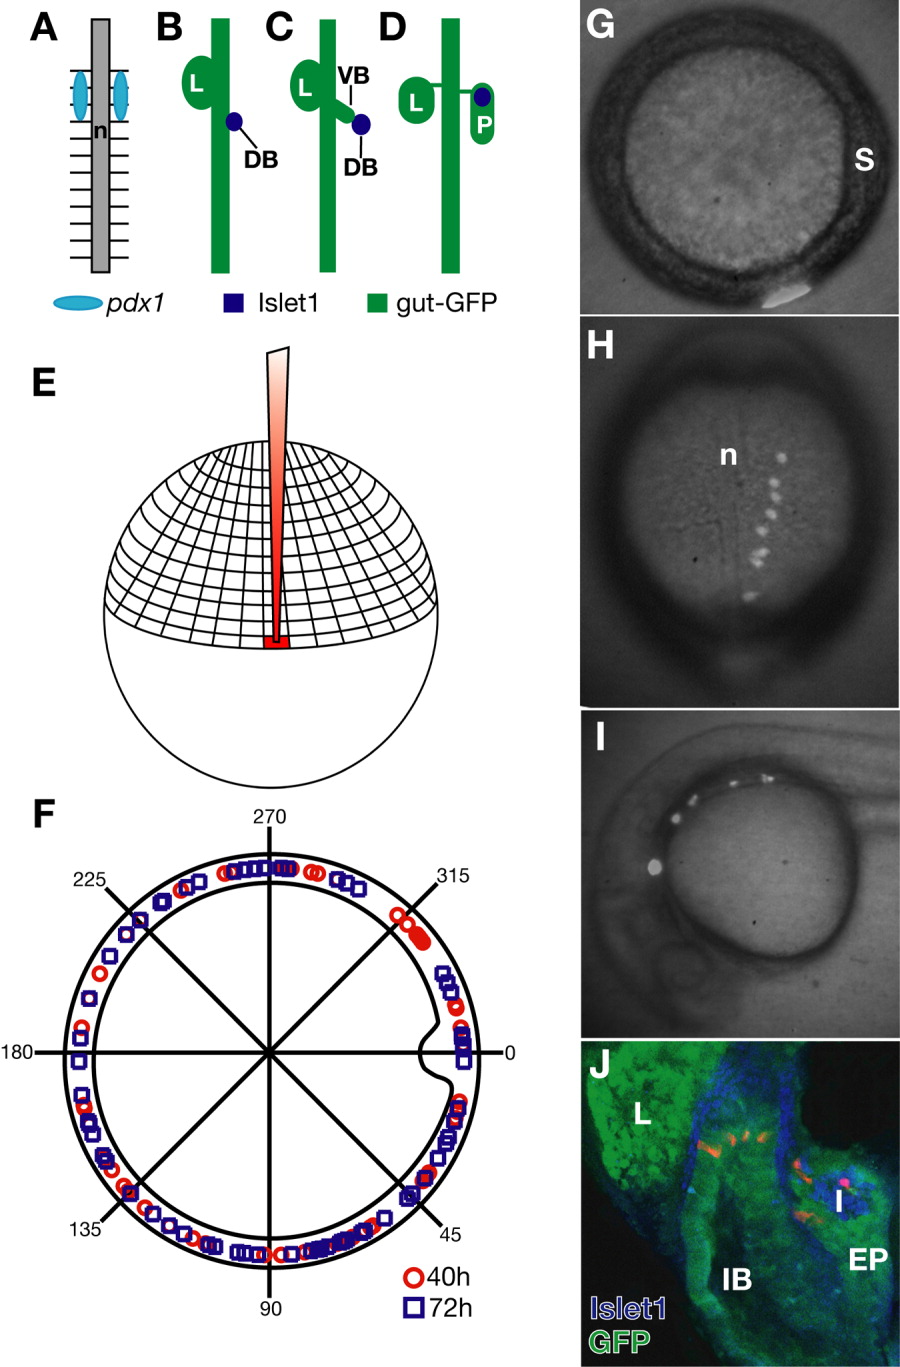
Fig. 1 Development of the pancreas in zebrafish and general fate map methodology. A: pdx1 is expressed bilaterally adjacent to the notochord of the anterior trunk at 14 hours postfertilization (hpf; based on Biemar et al.,[2001]). B-D: Morphogenesis of the pancreatic buds in zebrafish (based on Field et al.,[2003]). B: 24 hpf. The posterodorsal bud is visible. C: At 40 hpf. Both posterodorsal and anteroventral buds are visible, but have not fused. D: At 52 hpf. The buds have fused. E: One marginal blastomere was injected at the 512- to 2000-cell stage. F: Location of injected cells that gave rise to endoderm. Red circles were locations for the 40 hpf analysis, and blue squares were for the 72 hpf analysis. G-J: Embryos were imaged at various time points using brightfield and fluorescence, and photos were merged. G: At 6 hpf. H: At 10 hpf. I: At 24 hpf. J: Dorsal view of 72 hpf embryo showing rhodamine dextran-labeled cells in the exocrine and endocrine pancreas. Anti-Islet1 (blue) labels the endocrine pancreas and anti-green fluorescent protein (GFP; green) labels the postpharyngeal endoderm in gut-GFP embryos. DB, posterodorsal pancreatic bud; EP, exocrine pancreas; I, pancreatic islet; IB, intestinal bulb; L, liver; N, notochord; P, pancreas; S, embryonic shield; VB, anteroventral pancreatic bud.