
Image
|
Figure Caption
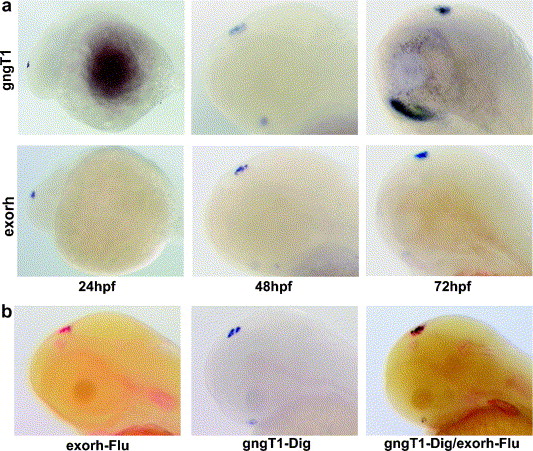
Fig. 4 Comparison of the gngT1 and exorh expression in the pineal gland. (a) Lateral view of the gngT1 and exorh transcripts at 24, 48 and 72 hpf. (b) Two-color in situ hybridization using exorh and gngT1 probes at 48 hpf. Fast red staining for exorh (red) and NBT/BCIP for gngT1 (blue). exorh, exo-rhodopsin; Flu, fluorescein; Dig, digoxigenin.
Figure Data
Acknowledgments
This image is the copyrighted work of the attributed author or publisher, and
ZFIN has permission only to display this image to its users.
Additional permissions should be obtained from the applicable author or publisher of the image.
Reprinted from Gene expression patterns : GEP, 7(5), Chen, H., Leung, T., Giger, K.E., Stauffer, A.M., Humbert, J.E., Sinha, S., Horstick, E.J., Hansen, C.A., and Robishaw, J.D., Expression of the G protein gammaT1 subunit during zebrafish development, 574-583, Copyright (2007) with permission from Elsevier. Full text @ Gene Expr. Patterns