
|
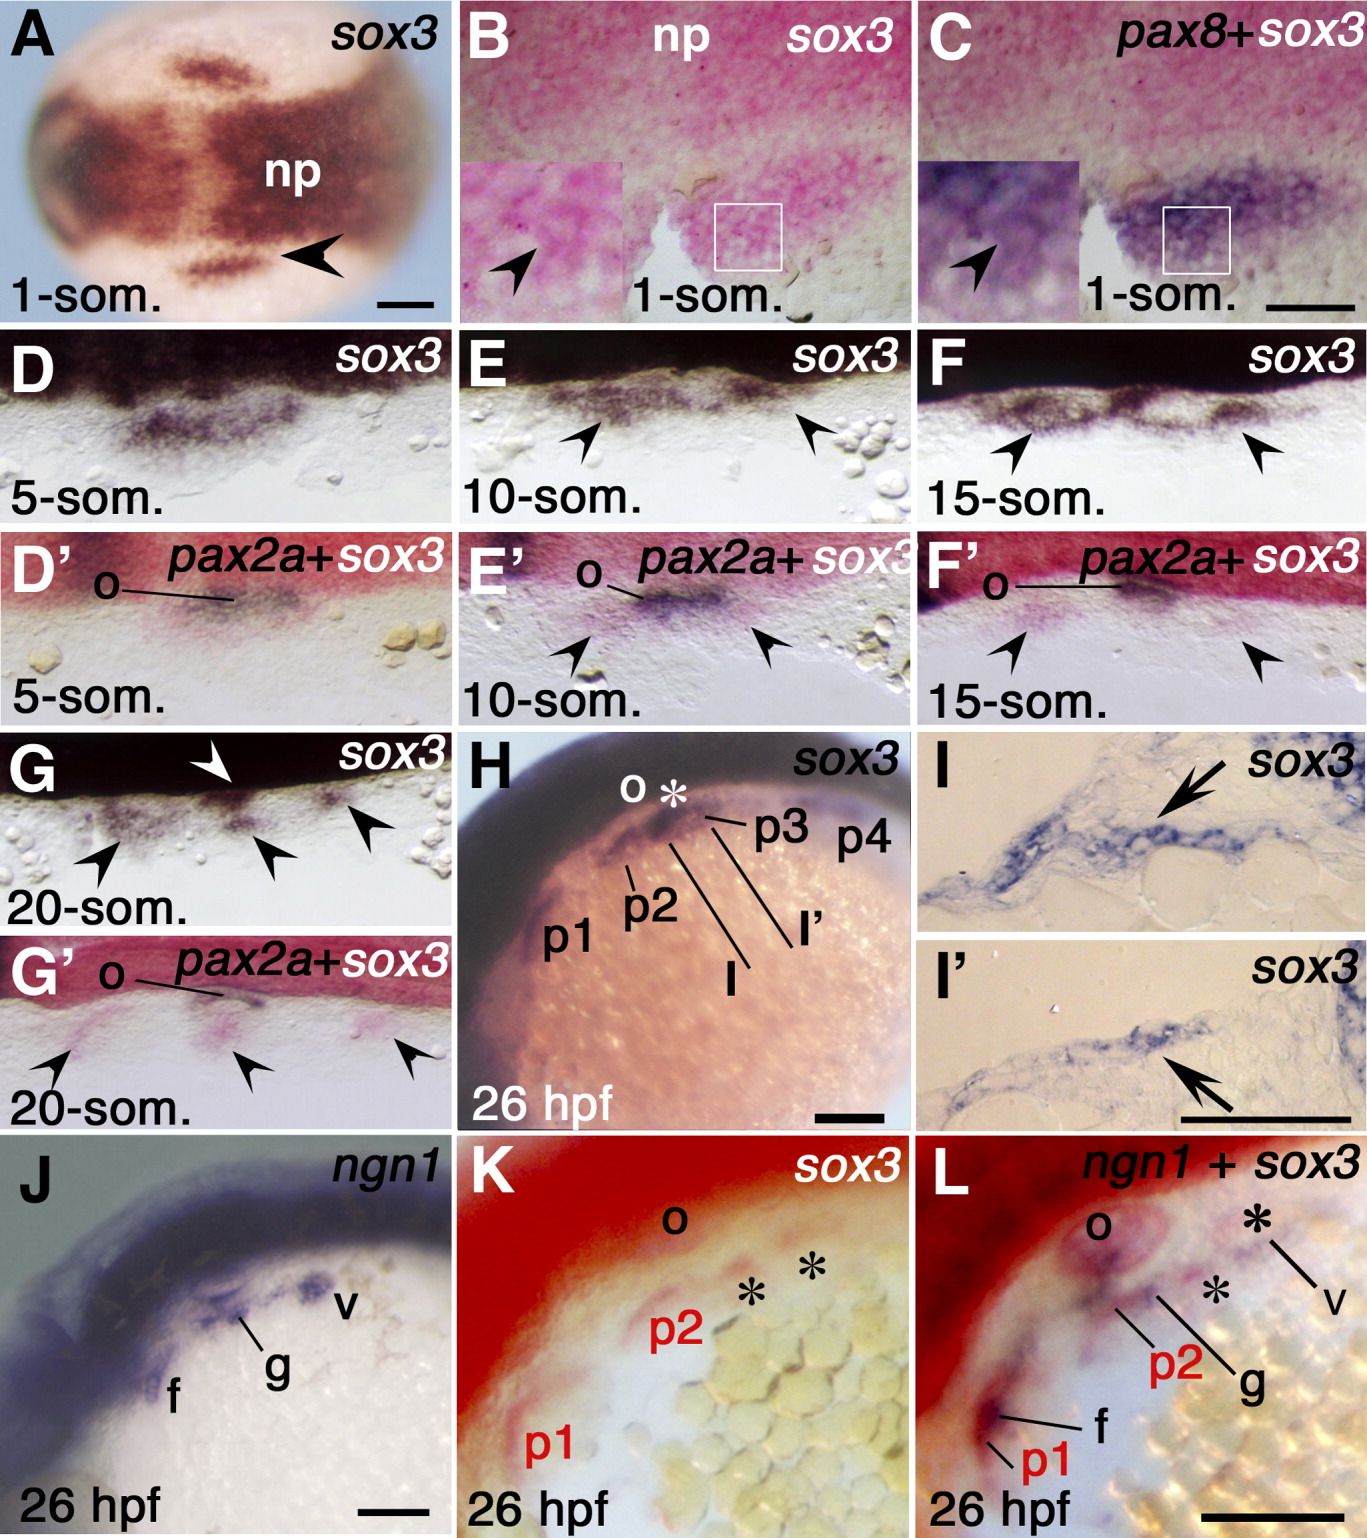
Fig. 1 Expression of zebrafish sox3 during development. A-C: Expression of sox3 and pax8 in the placodal region at the one-somite stage. sox3 is expressed both in the neural plate (np) and placode (arrowhead in A). Embryos were stained for sox3 (B, red), and the same embryos were further stained for pax8 (C, blue). Insets in B and C are high-magnification views of the regions enclosed by the white squares. Arrowheads in B and C mark the same cell. D-I,I′ Expression of sox3 in the epibranchial placodes during somitogenesis. sox3-expressing subdomains are indicated by arrowheads (D-G) or "p1"-"p4" (H). Sections I and I′ were taken at the planes shown in H. In I and I′, arrows indicate mesendodermal and ectodermal sox3 expression, respectively. D′-G′: Comparison of sox3 (red) and pax2a (blue) expression. Black arrowheads indicate sox3-expressing subdomains. J:ngn1 expression in a wild-type embryo at 26 hours postfertilization (hpf). K,L: Comparison of the expression of sox3 (red) and ngn1 (purple) in the same wild-type embryo at 26 hpf. Asterisks indicate the mesendodermal sox3 expression. A,H,J-L: Dorsal (A) or dorsolateral (H,J-L) views, with anterior to the left. B-G,D′-G′: Flat-mount dorsal views, with anterior to the left. In all panels, the stages examined are indicated at the bottom, and the genes examined are at the top right. f, facial placode/ganglion; g, glossopharyngeal placode/ganglion; o, otic vesicle; v, vagal placode/ganglion. Scale bars = 100 μm.