
|
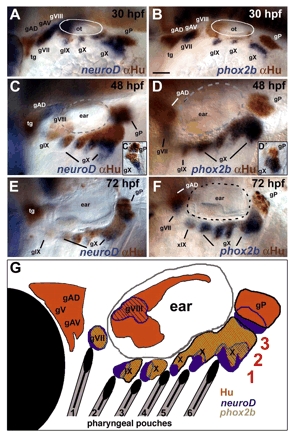
Fig. 1 Molecular markers of neurogenesis reveal heterogeneity within the epibranchial ganglia. Lateral views, anterior to the left, showing the pattern of dorsolateral and epibranchial ganglia at 30 (A,B), 48 (C,D) and 72 (E,F) hpf. Insets show vibratome sections of epibranchial ganglia from neurod/α-Hu (C′) and phox2b/α-Hu (D′) double-stained 48 hpf embryos. (A,C,C′,E) In situ hybridization to detect neurod mRNA in newly specified neural progenitors (blue), partially overlaps with α-Hu staining in differentiating neurons (brown). (B,D,D′,F) Most neural progenitors co-express phox2b at 30 hpf (B) but expression becomes restricted to a more proximal populations by 48 and 72 hpf (D,F). (G) Diagram indicating the spatial relationships of pharyngeal pouches (1-6, black), and three domains of gene expression within the ganglia (1-3, red). Hu+ proximal neural progenitors are shown in orange, phox2b+ cells in green (overlap with Hu is indicated as diagonal hatching) and more distal neurod+ cells in blue. gAD, dorsal anterior lateral line; gAV, ventral anterior lateral line; gP, posterior lateral line; gV, trigeminal; gVII, facial (geniculate), gVIII, auditory; gIX, glossopharyngeal (petrosal); gX, vagal (nodose); ot, otic placode; tg, trigeminal. Scale bar: 50 μm.