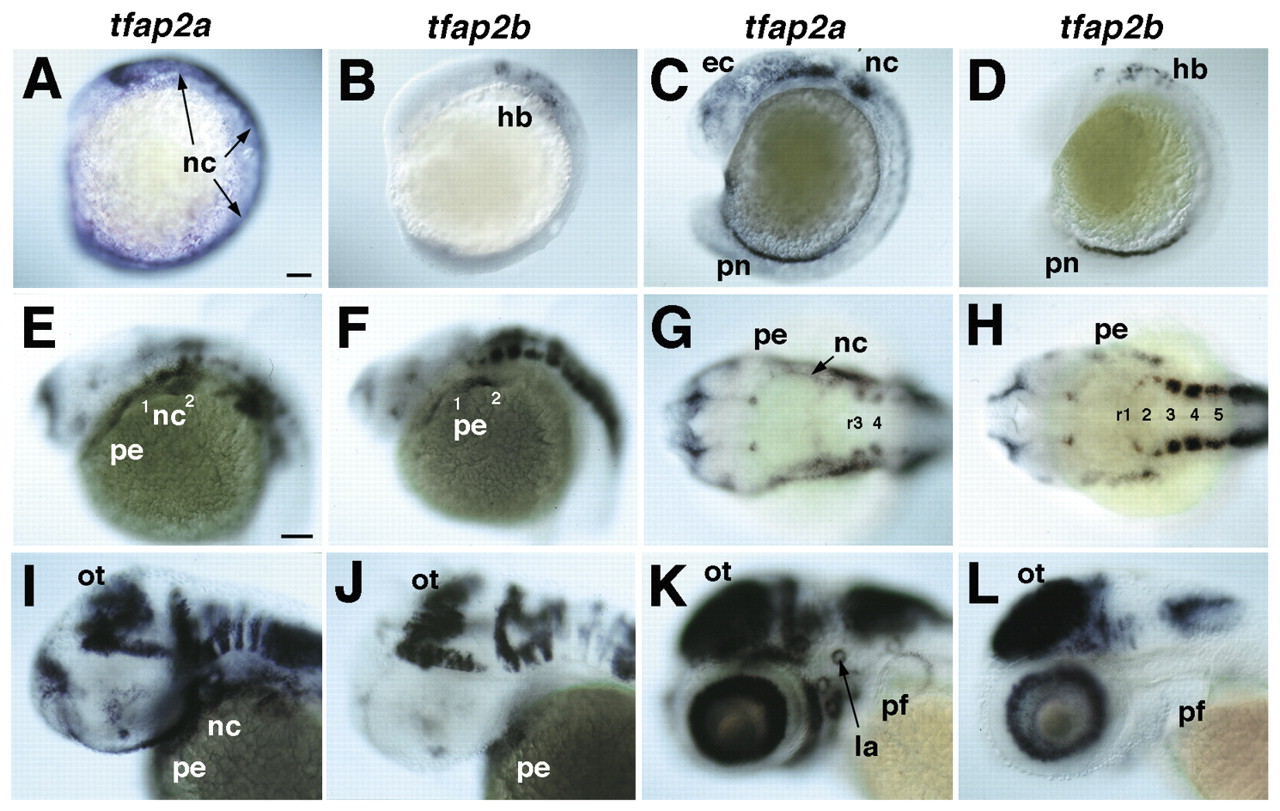
Fig. 2 Expression of tfap2a and tfap2b in early zebrafish embryos. Whole-mount in situ hybridization was performed with antisense RNA probes. Anterior is towards the left. (A,B) Lateral views at eight somites. (A) Expression of tfap2a in neural crest (nc) and non-neural ectoderm. (B) Hindbrain (hb) expression of tfap2b. (C,D) Lateral views, 18 somites. (C) tfap2a expression in migrating cranial NCCs, non-neural ectoderm (ec) and pronephric duct (pn). (D) tfap2b expression in the hindbrain and co-expression with tfap2a in the pronephric duct. (E,F) Lateral views of the head at 24 hpf showing co-expression of tfap2a and tfap2b in the forebrain, and in segmental cell groups in the hindbrain. (E) tfap2a expression in the pharyngeal NCCs (nc) and ectoderm (pe). (F) tfap2b expression in the ectoderm of arches 1 and 2. (G,H) Dorsal views, 24 hpf. (G) tfap2a expression in the CNS, including rhombomeres (r3 and r4) and in pharyngeal NCCs and ectoderm. (H) tfap2b expression in rhombomeres of the hindbrain and in pharyngeal ectoderm, but not in NCCs. (I,J) Lateral views, 36 hpf. tfap2a and tfap2b co-expression in the optic tectum (ot) and tegmentum of the midbrain and hindbrain, and in the pharyngeal ectoderm. Only tfap2a is expressed in NCCs. (K,L) Lateral views, 52 hpf. tfap2a and tfap2b co-expression in the midbrain and hindbrain, and in the ganglion cell layer of the retina. Only tfap2a is expressed in the pharyngeal arches, lateral line organs (la) and in the apical ectoderm of the pectoral fins (pf). Scale bars: in A, 100 µm for A-D; in E, 100 µm for E-L.

