
Image
|
Figure Caption
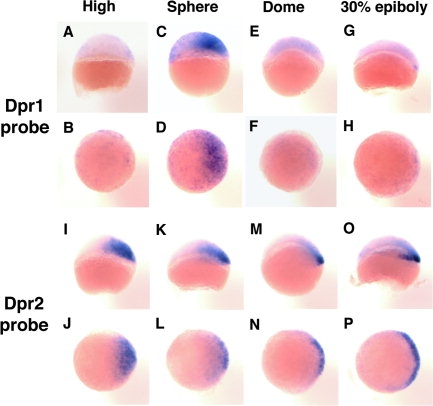
Fig. 1
Expression of zebrafish dpr1 is dynamic from high through 30% epiboly, relative to zebrafish dpr2. A-H: Zebrafish dpr1 expression. I-P: Zebrafish dpr2 expression. A,C,E,G,I,K,M,O are lateral views. B,D,F,H,J,L,N,P are animal views. Dorsal is to the right.