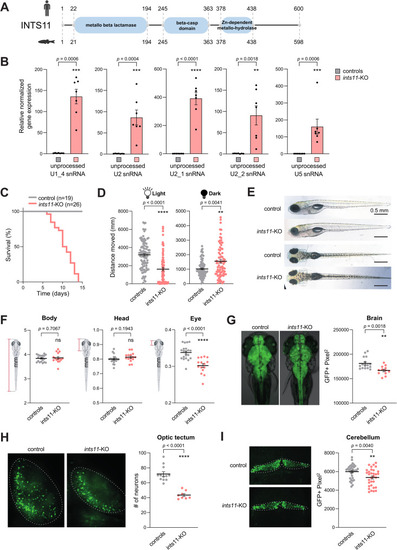
ints11-deleted zebrafish exhibit increased unprocessed U snRNAs, abnormal motor behaviour, and reduced brain size. A Schematic representation of the three main INTS11 functional domains (metallo-beta-lactamase, beta-CASP, and C-terminal) which are conserved between human and zebrafish. B RT-qPCR analysis of 3’ unprocessed snRNAs (U1_4, U2, U2_1, U2_2, U5) in 5 days post-fertilization (dpf) larvae. Data show fold-change relative to controls (ΔΔCt method). P-values from the Mann-Whitney test for U1_4 and U5; p-values from the two-tailed Student’s t-test for U2, U2_1 and U2_2: **p < 0.01, ***p < 0.001, ****p < 0.0001 (n > 35, N = 3). C Kaplan-Meier survival analysis over 14 dpf comparing ints11-KO larvae (n = 26) with controls (n = 19). D Quantification of total distance moved (mm) per larvae over one hour using an automated recording chamber tracking. The total distance swam by ints11-KO larvae was significantly increased in the dark (**p < 0.01) but decreased in the light (****p < 0.0001) compared to controls. P-values from the Mann-Whitney test; sample sizes: controls (n = 93), ints11-KO (n = 77). E Representative bright-field lateral and dorsal images of control and ints11-KO larvae at 5 dpf. Scale bar: 0.5 mm. F Quantification of body size, head length, and eye diameter in control (n = 20) and ints11-KO (n = 16) larvae. P-values from the two-tailed Student’s t-test: ****p < 0.0001; ns – not significant. G Representative dorsal images of 5 dpf larval brains from Tg(elavl3: GFP) transgenic lines and quantification of brain size showing a significant reduction in ints11-KO larvae. P-value from the Mann-Whitney test: **p < 0.01; sample sizes: controls (n = 18), ints11-KO (n = 13). H Confocal imaging (20×) of Tg(elavl3:GFP) larvae at 5 dpf revealing a significant reduction in neuronal content in ints11-KO larvae compared to controls. P-value from the two-tailed Student’s t-test: ****p < 0.0001; sample sizes: controls (n = 12), ints11-KO (n = 8). I Confocal images (20×) of 5 dpf larvae immunolabeled with anti-parvalbumin-7 (PAV7), revealing a significant reduction in cerebellar size in ints11-KO larvae compared to controls. P-value from the two-tailed Student’s t-test: **p < 0.01; sample sizes: controls (n = 33), ints11-KO (n = 34)
|
