
Fig. 2
- ID
- ZDB-FIG-260702-126
- Publication
- Breuer et al., 2026 - Chd7 regulates lipid metabolism and swim bladder inflation in zebrafish
- Other Figures
- All Figure Page
- Back to All Figure Page
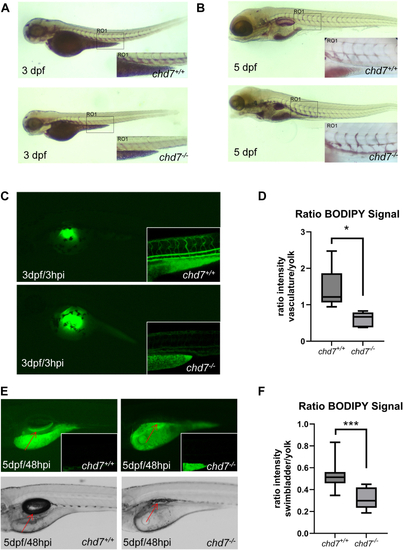
Lipid dyslipidemia and transport in chd7+/+ and chd7−/− mutants. A: Representative images for 3 independent experiments (n = 15 larvae per replicate and genotype) of neutral lipid ORO staining in 3 dpf chd7+/+ (top) and chd7−/− mutants (bottom). B: Representative images for 3 independent experiments (N) of ORO staining in 5 dpf chd7+/+ (top) and chd7−/− mutants (bottom) with close up of caudal vein region (chd7+/+; N = 3, n = 12 and chd7−/−; N = 3, n = 11). C: Representative imaging for 3 independent experiments of BODIPY FL-C12 fluorescence at 3 dpf and 3 hpi chd7+/+ (n = 6 larvae per experiment) and chd7−/− mutants (n = 5 larvae per experiment) with overview and close up of vascular system. D: Quantitative analysis of BODIPY signal. Ratio of average intensity measured in the yolk against intensity in the vasculature. (N = 3, n = 5 larvae per experiment). E: Imaging of BODIPY FL-C12 fluorescence at 5 dpf and 48 hpi chd7+/+ (n = 5 larvae per experiment) and chd7−/− mutants (n = 4 larvae per experiment) and close up of vascular system. Representative images for 3 independent experiments (n represents larvae per sample/genotype). F: Quantitative analysis of BODIPY signal. Ratio of fluorescence intensity measured in the yolk against swim bladder. (N = 3, n = 4–5 larvae per experiment). (Significance: ∗P < 0.05; ∗∗P < 0.01; ∗∗∗P < 0.001, Error bars represent SD). Images were taken using a Zeiss Apotome. |
| Fish: | |
|---|---|
| Observed In: | |
| Stage Range: | Protruding-mouth to Day 5 |