
Fig. 1
- ID
- ZDB-FIG-260702-125
- Publication
- Breuer et al., 2026 - Chd7 regulates lipid metabolism and swim bladder inflation in zebrafish
- Other Figures
- All Figure Page
- Back to All Figure Page
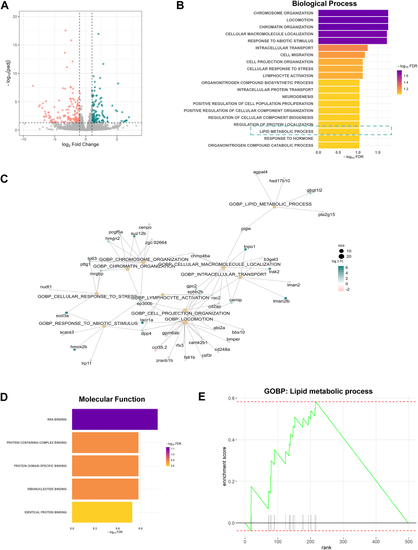
RNA-Seq Analysis of chd7−/− mutants. A: Volcano plot showing transcriptomic responses (each gene plotted according to its log2 fold change) in 2 dpf whole zebrafish chd7−/− embryos, relative to chd7+/+ controls (N = 3 from 10 pooled fish per sample/genotype). Differentially expressed genes (P < 0.05) are in salmon (downregulated) or teal (upregulated). B: Biological processes that are enriched in the differentially expressed genes. C: Cnet plot representing the linkage between the significantly dysregulated genes to enriched biological processes (BP) from gene set enrichment analysis in chd7−/− mutants. D: Molecular function that are enriched in the differentially expressed genes. E. Enrichment plots from gene set enrichment analysis (GSEA) representing the top-enriched BP in chd7−/− mutants. Each vertical black line marks the position in the ranked gene list of a gene that belongs to the BP:Lipid Metabolic Process gene set. The green curve represents the running enrichment score. The peak (maxima) of the green line is the enrichment score that is reported for this gene set. The red dashed lines show the maximum and minimum values of the running enrichment score. |